5.2 Relative frequency
The experimental probability, or relative frequency, of an event is the ratio of the number of outcomes in which a specified event occurs to the total number of trials in an actual experiment. This is different from the theoretical probability of an event, which we will discuss in Section 5.3.
In the horse race example, the event is ‘getting a score of 8 on two dice’ (or any of the other totals) and the total number of trials is the number of times the two dice are thrown.
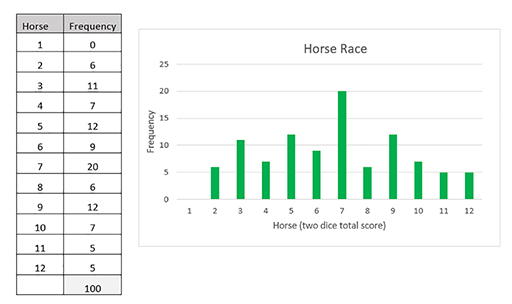
For example: the horse race game was played by rolling a pair of dice 100 times. This means the total number of trials is 100.
The frequencies of each total score have been recorded in the table in Figure 34. These represent the number of outcomes of each specific event (i.e. the number of times each score was rolled). The bar chart gives an overview of the distribution of the data.

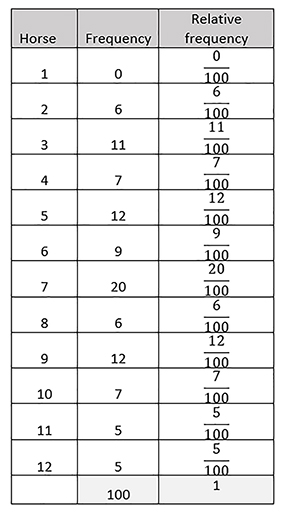
The relative frequency is calculated by dividing the number of times each event occurred by the total number of trials.
For example, if the event is ‘scoring an 8 when rolling two dice’, the relative frequency is
since a score of 8 was recorded 6 times and there were 100 rolls altogether.
You can see the relative frequencies of all 12 scores, shown as fractions, in Figure 35.
Note that the total of the relative frequencies must sum to 1, since all possibilities have been included.
We will discuss how experimental probability (relative frequency) relates to theoretical probability in Section 5.4.

