

2.1 Statistical thinking and the PCAI cycle
Statistical thinking involves more than just calculating averages and plotting graphs. In the English National Curriculum (2014), students are expected to ‘interpret and present data’ from 7 years of age. Students in lower secondary school, aged 11–14, are expected to ‘describe, interpret and compare’ data and to ‘describe simple mathematical relationships between two variables’.
In order for learners to develop statistical thinking, they need to be encouraged to discuss the meaning behind their calculations and to interpret measures and graphs within relevant contexts. Statistics lessons must therefore involve more than just teaching techniques and methods.
Outside a school setting, statistics are rarely calculated in isolation. Data is collected, analysed and interpreted with a purpose, to investigate something or to answer a research question.
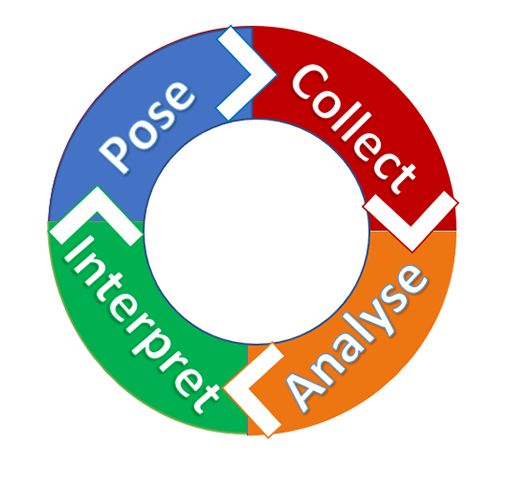
Learners can be introduced to the concept of a statistical investigation using the PCAI cycle (Figure 6).
PCAI stands for: pose (a question), collect, analyse and interpret (the data).
Example
Here is an example of a simple statistical investigation with young learners.
Pose: learners want to find out which type of pet is favoured by their classmates (Figure 7). The question that they will investigate is: ‘What is the most popular pet?’
This could be further refined as: ‘What is the most popular pet in our class?’

Collect: learners will ask each of their classmates what their favourite pet is, and record the results in a tally chart, similar to the one in Figure 8.
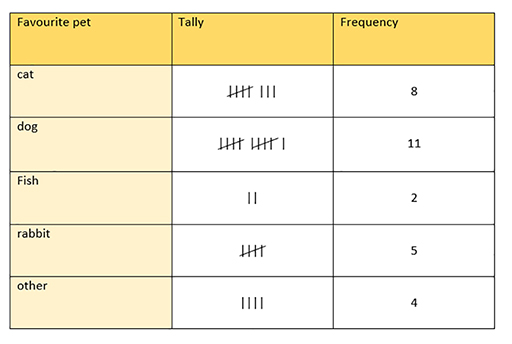
Analyse: learners will add up the totals in their tally charts, to compare the popularity of each pet. They will then produce a bar chart to present this data visually (Figure 9).
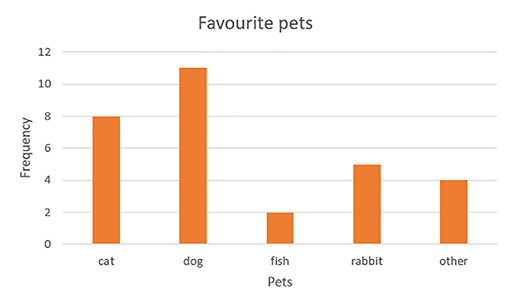
Interpret: learners will look at their bar charts and totals from their table to decide which is the most popular pet in their class.
This is a very simple example of a statistical investigation, but the PCAI cycle can be used with learners of all ages and experiences as the question posed, data collection method, data analytics and interpretation of data can all be varied in levels of sophistication.
For instance, in the UK, older students may use a large data set from the Office for National Statistics to investigate employment levels, using box plots to compare employability in different ages groups.