

2.2 Analysing data using measures of central tendency and spread
The mean, median and mode are measures of central tendency. Each of these averages gives an indication of the typical or central value in the data set.
The range is a measure of spread. It tells us how much a data sample is spread out or scattered.
These measures can be used to summarise a data set and help us to make conclusions about what the data shows.
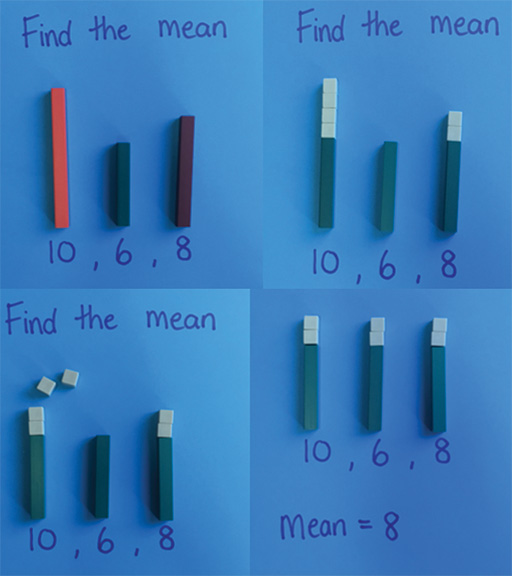
The mean
The mean is the most common measure of average. To calculate the mean, add the numbers together and divide the total by the amount of numbers:
Mean = sum of numbers ÷ amount of numbers
Activity _unit9.2.1 Activity 8 Sharing sweets fairly
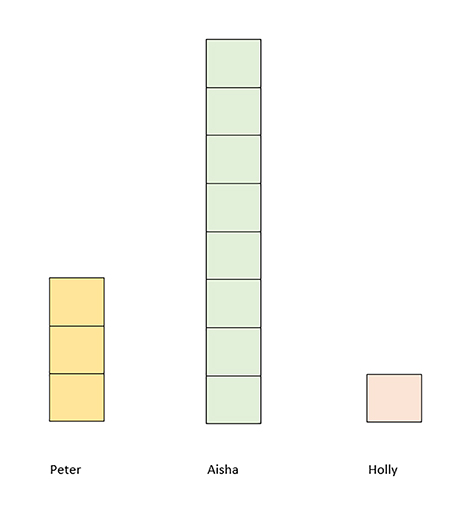
Three friends have each been given some sweets (Figure 10).
Peter has 3 sweets, Aisha has 8 sweets and Holly has 1 sweet.
How could the sweets be shared fairly between the three friends?

Discussion
This question is asking for the mean average. Between the 3 children there are 12 sweets. Dividing this by 3 would mean that each friend receives 4 sweets.
The mean average is 4.
Activity _unit9.2.2 Activity 9 Reflecting
How would you present the question above to your learners?
How would you help them to understand what the mean represents?
Discussion
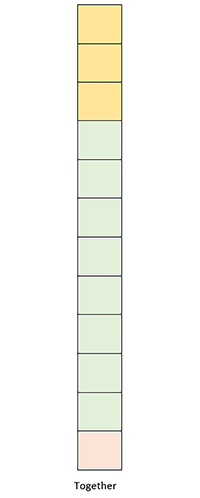
Using concrete resources such as counters, cubes or coins can help learners to understand the concept of the mean average (Figure 11). They can physically move the objects to share them out evenly.
This can become more challenging when learners are required to find fractions of amounts.
For example:
If four learners have 3, 5, 4 and 2 cubes respectively, what is the mean number of cubes?
3 + 5 + 4 + 2 = 14
14 ÷ 4 = 3½
IIn this example, cubes could be used to show that each learner gets 3 cubes and that there are 2 cubes left over. Depending on the age and experience of the learners, they can then record the mean as 3 remainder 2, or they can discuss how to share the remaining two cubes between four.
It can be helpful to have objects which can be split in half, when working on problems like this for the first time, including edible resources!
Another way would be to use pictorial representations of the problem (see Figures 12 to 14).
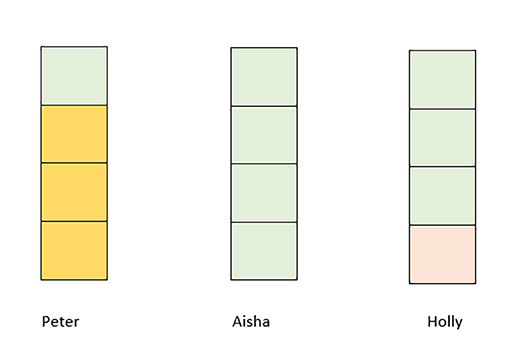
With pictorial representations, halves, quarters and other fractions can be represented more easily.
The mode
The mode is the value that occurs most often.
The mode is the only average that can have more than one value.
When finding the mode, it helps to order the numbers first.
For example, here are the ages of a group of learners:
10, 8, 11, 9, 10, 12, 13, 11, 10, 11
Putting them in order, from smallest to largest, we have:
8, 9, 10, 10, 10, 11, 11, 11, 12, 13
There are three 10s and three 11s, so there are two modes.
We can call this data set bi-modal. The mode is 10 and 11.
The median
The median is the middle number in an ordered set.
If there are two middle numbers, the median is the mean of those two numbers.
For example, using the same ordered set of data as above, the two middle numbers are 10 and 11, so the median is 10.5 (Figure 15)
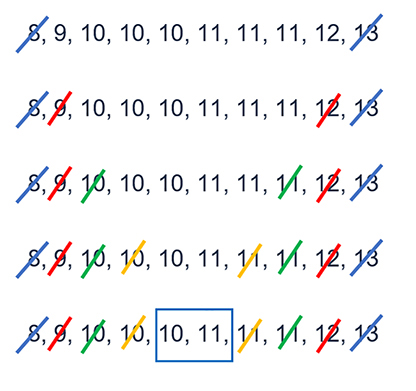
The median is the mean of the two middle values 10 and 11. So the median is 10.5.