

1 Solar energy
The Sun will radiate energy until it ceases thermonuclear fusion, in around 5 billion years. The solar power that enters the Earth's system is 1.1 × 10⁵TW (0.3 × 10⁵ TW to atmospheric heating and 0.8 × 10⁵ TW absorbed at the surface - Figure 1). This is equivalent to a global energy supply of 3.5 × 10⁶ EJ yr−1. About 33% heats the atmosphere and contributes to setting winds and waves in motion. Of that reaching the Earth's surface, 70% falls on the sea, setting in motion ocean currents and a large proportion of the circulation of water vapour in the atmosphere because of evaporation from the ocean surface. The remainder falls on the land. Figure 1 shows the complexity of primary redistribution of solar energy through interlinked surface systems:
the carbon cycle based on photosynthesis;
atmospheric circulation and the water cycle;
winds and ocean waves; and the ocean current system.
Each of them is a potential source of useable energy: this course discusses the direct use of solar energy.
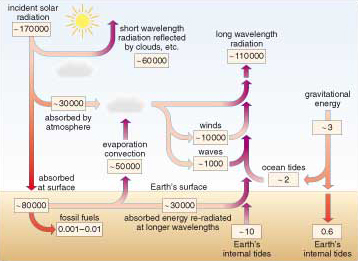
In every case, with the exception of the energy available from surface water flow, humanity comes nowhere near exploiting the Sun's potential to supply useable energy; in fact, we really do not know the practical limits. Whatever those are, they will not disappear as a resource - all are renewable. Compare this with the solar energy stored chemically by the degraded products of photosynthesis in fossil fuels. Although carbon burial adds continually to that resource, its pace of renewal (between 1 to 10 GW - Figure 1) is about 2000 times slower than we use it. Fossil fuels are non-renewable and declining extremely quickly in terms of human history.
In British summers direct sunlight (insolation) on a clear day can reach power densities of up to 1 kW m−2 when the Sun is at its highest in the sky (the daytime average is about 450 W m−2), and supplies around 6.5 kWh m−2 per day (450 W m−2 × about 14 hours of daylight in June) (Figure 2a). This is enough to heat a bathful of water to a comfortable temperature. Summer insolation in southern Europe (~30° N on Figure 2a) reaches 7.5 kWh m−2 per day (by virtue of a higher Sun angle). Winter insolation is much lower. In January, northern Europe (~60° N on Figure 2a) has an average insolation around 10% of its summer value and around only 20% of the January value in southern Europe. In the tropics (0° N on Figure 2a), insolation shows far less seasonal fluctuation. Solar energy collection in northern Europe is therefore most effective in the summer, in southern Europe there is useful winter potential as well, and at low latitudes it can be used throughout the year. High latitudes have a problem with solar energy; it is most abundant when it is least needed, i.e. in summer. Although variations in cloudiness reduce insolation, diffuse solar energy still reaches the surface at a power density that is often useable.
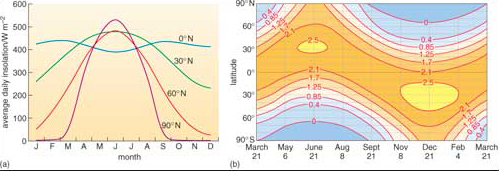
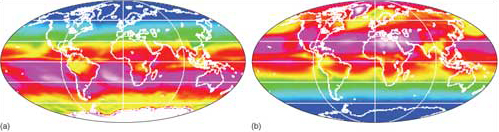
Curvature of the Earth's surface and the inclination of its rotational axis relative to the Sun result in insolation declining from a maximum in the tropics towards higher latitudes (Figure 2b). There is also considerable variation with the seasons. Satellite data give a more realistic view of the amount of available solar energy across the planet (Figure 3). One surprising feature is that summer months in Greenland and Antarctica have the highest actual insolation on the planet. That is partly because the Sun shines for 24 hours each summer day, but also because ice caps are usually free of cloud during summer months - high-pressure air masses exclude moist air from the oceans. (Note: Much is reflected away by ice and snow.) Bar that oddity, available solar energy varies roughly as expected, but always lower than theory predicts (Figure 2) because of cloud cover.
Direct solar energy use is of two basic kinds; using it as a source of heat or converting it into electricity using photovoltaic technology.