

4.2.2 Analysing a fund’s performance
The fund is a strong long-term choice for investors seeking a balanced multi-asset fund with exposure to a variety of asset classes.
Using the internet, you can find performance measures based on portfolio theory and the CAPM to analyse funds such as the Newton Balanced Income Fund. This particular fund achieved a three year positive mean return and a positive Sharpe Ratio over three years, meaning that it returned more than the risk-free rate over the period. The beta is 0.93 compared to a benchmark index, which makes the fund slightly less exposed to market movements than its benchmark comparator. The negative alpha means that the fund’s return has been penalised for taking on specific risk through stock selection and not just mirroring the benchmark index (Table 4.1).
| Newton Balanced Income Fund | Performance and features |
|---|---|
| 3-year standard deviation | 7.19% |
| 3-year mean return | 5.64% |
| 3-year Sharpe Ratio | 0.69 |
| 3-year R-squared | 76.64% |
| 3-year beta | 0.93 |
| 3-year alpha | -5.41 |
| 10 years annualised return | 7.70% |
Figure 6 shows the ten-year performance of £1000 invested in the Newton Balanced Income relative to the chosen peer group and the chosen benchmark index. The peer group included several hundred other income funds with the same investment objectives. This shows the fund’s superior performance over the period until 2013 compared with both the index and the average performance of the peer group. Consequently the investment analyst firm Morningstar awarded it a 5-star rating for the 10-year performance – but a ‘below’ average 2-star rating for its 3-year and 5-year performances.
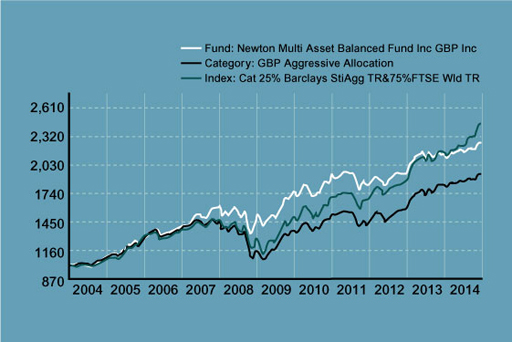
So, for the overall period from 2004 to 2014, we would have been happy to have invested in the Newton Balanced Income Fund instead of another fund in the same peer group. By contrast, over the 10-year period there was little to choose between this fund or the index fund tracking the chosen benchmark index. But the problem is how to identify the best performing funds before the event and not after. The figure above shows that the average peer group performance was worse over the 10-year period than that of the Newton Balanced Income Fund. Furthermore, some funds would have performed worse than the peer group since this is an indicator of average performance. So, only if we were very lucky, and had picked a fund manager who did well, would we have achieved our target return, as measured by the index, or more. Tracking the benchmark index therefore offers a strategy of avoiding investment in the weaker performing funds.
[Note that while the analysis above covers the performance of the fund between 2004 and 2014, the discussion of how to assess fund performance remains relevant today.]
By far the most common indicator of performance is simply returns over the past year, three years and five years. Since markets may well experience a bull or bear phase over more than five years, aggressive funds will look good in the good years and defensive funds will look good in the bad years. An example of an aggressive fund is a growth fund, a fund that looks for companies with growth potential but may be expensive in earnings terms (that is, have high price–earnings ratios, P/E – a measure you looked at in Week 2), as did internet companies in the late 1990s. An example of a defensive fund is a value fund, which invests in companies that look relatively cheap on fundamental ratios such as P/E, dividend yield or Tobin’s Q (which we also looked at in Week 2).
Indeed, some fund management groups make sure that they have a wide range of different types of fund to make sure that they always have at least one or two near the top of the league tables, whatever the state of the stock market. This is another example of how diversification informs investment strategy.