

4.2 Two-tailed tests
Hypotheses that have an equal (=) or not equal (≠) supposition (sign) in the statement are called non-directional hypotheses. In non-directional hypotheses, the researcher is interested in whether there is a statistically significant difference or relationship between two or more variables, but does not have any specific expectation about which group or variable will be higher or lower. For example, a non-directional hypothesis might be: ‘There is a difference in the preference for brand X between male and female consumers.’ In this hypothesis, the researcher is interested in whether there is a statistically significant difference in the preference for brand X between male and female consumers, but does not have a specific prediction about which gender will have a higher preference. The researcher may conduct a survey or experiment to collect data on the brand preference of male and female consumers and then use statistical analysis to determine whether there is a significant difference between the two groups.
Non-directional hypotheses are also known as two-tailed hypotheses. The term ‘two-tailed’ comes from the fact that the statistical test used to evaluate the hypothesis is based on the assumption that the difference or relationship could occur in either direction, resulting in two ‘tails’ in the probability distribution. Using the coffee foam example (from Activity 1), you have the following set of hypotheses:
H0: µ = 1cm foam
Ha: µ ≠ 1cm foam
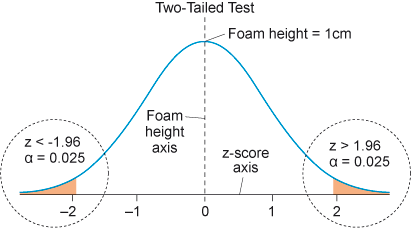
In this case, the researcher can reject the null hypothesis for the mean value that is either ‘much higher’ or ‘much lower’ than 1 cm foam. This is called a two-tailed test because the rejection region includes outcomes from both the upper and lower tails of the sample distribution when determining a decision rule. To give an illustration, if you set alpha level (α) equal to 0.05, that would give you a 95% confidence level. Then, you would reject the null hypothesis for obtained values of z 1.96 (you will look at how to calculate z-scores later in the course).
This can be plotted on a graph as shown in Figure 7.
In a two-tailed hypothesis test, the null hypothesis assumes that there is no significant difference or relationship between the two groups or variables, and the alternative hypothesis suggests that there is a significant difference or relationship, but does not specify the direction of the difference or relationship.
When performing a two-tailed test, you need to determine the level of significance, which is denoted by alpha (α). The value of alpha, in this case, is 0.05. To perform a two-tailed test at a significance level of 0.05, you need to divide alpha by 2, giving a significance level of 0.025 for each distribution tail (0.05/2 = 0.025). This is done because the two-tailed test is looking for significance in either tail of the distribution. If the calculated test statistic falls in the rejection region of either tail of the distribution, then the null hypothesis is rejected and the alternative hypothesis is accepted. In this case, the researcher can conclude that there is a significant difference or relationship between the two groups or variables.
Assuming that the population follows a normal distribution, the tail located below the critical value of z = –1.96 (in a later section, you will discuss how this value was determined) and the tail above the critical value of z = +1.96 each represent a proportion of 0.025. These tails are referred to as the lower and upper tails, respectively, and they correspond to the extreme values of the distribution that are far from the central part of the bell curve. These critical values are used in a two-tailed hypothesis test to determine whether to reject or fail to reject the null hypothesis. The null hypothesis represents the default assumption that there is no significant difference between the observed data and what would be expected under a specific condition.
If the calculated test statistic falls within the critical values, then the null hypothesis cannot be rejected at the 0.05 level of significance. However, if the calculated test statistic falls outside the critical values (orange-coloured areas in Figure 7), then the null hypothesis can be rejected in favour of the alternative hypothesis, suggesting that there is evidence of a significant difference between the observed data and what would be expected under the specified condition.