

4.3 One-sided tests
As well as non-directional hypotheses, you will also encounter hypotheses that have a less than or equal to (≤) and greater than (>) supposition (sign) in the statement (as you saw in Activity 3). This is called a directional hypothesis. A directional hypothesis is a type of research hypothesis that aims to predict the direction of the relationship or difference between two variables. Essentially, it specifies the anticipated outcome of a study prior to the collection of data.
For example, a directional hypothesis might propose that a marketing campaign will increase product sales, predicting the direction of the relationship (i.e. the marketing campaign will lead to an increase in product sales). In contrast, a non-directional hypothesis simply states that there is a relationship between two variables without specifying the direction of that relationship, such as: ‘There is a relationship between the marketing campaign and product sales.’
Directional hypotheses are often preferred in scientific research because they provide a more precise and focused prediction than non-directional hypotheses. In business management, a directional hypothesis can also be a useful tool. For example, a company may use a directional hypothesis to design a study that examines the effectiveness of a marketing campaign in enhancing sales. This approach provides a clearer understanding of the impact of the campaign and enables the company to make more informed decisions about future marketing strategies.
A one-tailed test is a statistical test employed to evaluate a directional hypothesis, which predicts the direction of the difference or association between two variables. Its objective is to ascertain if the data supports the anticipated direction.
To illustrate, consider the hypotheses from Activity 3:
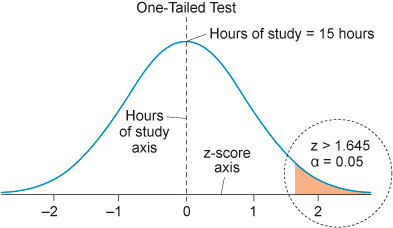
H0: µ ≤ 15 hours of studies
Ha: µ > 15 hours of studies
The null hypothesis (H0) posits that the population mean (µ) is less than or equal to 15 hours of studies, while the alternative hypothesis (Ha) predicts that the population mean is greater than 15 hours of studies.
To conduct a one-tailed test, a critical value must be established to determine whether the null hypothesis should be rejected or retained. Typically, a significance level (α) is set for this purpose. For instance, assuming α = 0.05, the z-score for a one-tailed test with α = 0.05 in a normal distribution is 1.645. Consequently, the null hypothesis would be rejected if the z-score exceeds 1.645. In other words, only the upper tail region of the distribution is rejected for a one-tailed test. Additionally, you employ distinct z-scores since, in contrast to a two-tailed test, the alpha level does not need to be divided by two. In a normal distribution, the area in the tail above z = +1.645 represents 0.5 of the distribution. This portion of the distribution is significantly remote from the centre of the bell curve at 0. Consequently, the null hypothesis would be rejected if the z-score exceeds 1.645 (as depicted in Figure 8).
In summary, a one-tailed test is used to assess a directional hypothesis in which the direction of the difference or association between two variables is predicted. The critical value for a one-tailed test is determined by the selected significance level (α), and the test is conducted to ascertain whether the data supports the predicted direction.
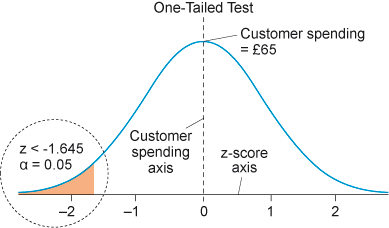
In addition, the one-tailed test is not limited to a single direction (greater than) but can also be employed in the opposite direction (less than). An example can be used to illustrate this type of hypothesis testing. Consider a situation where the management team believes that the average amount spent by customers during their visits to a department store is £65. However, the service manager observes that customers spend less than that amount during their visits. In this case, you can formulate the following set of hypotheses:
H0: µ ≥ £65
Ha: µ
To test this directional hypothesis, a one-tailed test must be conducted. The alternative hypothesis states that the specific value of µ will be lower than the value specified in the hypothesis. Therefore, you must reject the region in the lower tail of the normal distribution. More specifically, the rejection region of the one-tailed test at alpha levels equals 0.05. The lower tail of the normal distribution has a z-score lower than -1.645. Any hypothesis in this region will be rejected. The graph in Figure 9 illustrates this.
In conclusion, the one-tailed test is not restricted to a specific direction and can be used in either direction, depending on the research question and the hypothesis being tested. The test is used to determine if the data supports a directional hypothesis, and a critical value is established based on the significance level chosen for the test.