

3 Rates of change
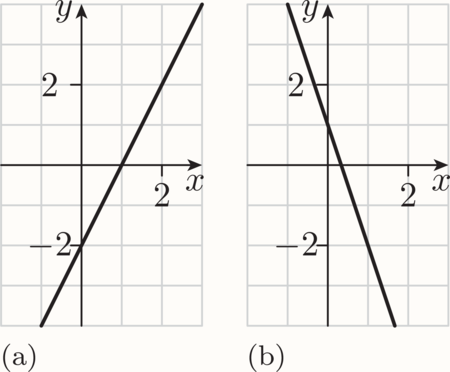
The gradient of a straight-line graph is the rate of change of the variable on the vertical axis with respect to the variable on the horizontal axis. For example, if the relationship between the variables and is represented by a straight line with gradient 2, then is increasing at the rate of 2 units for every unit that increases, as illustrated in Figure 29(a). Similarly, if the relationship between and is represented by a straight line with gradient , then is decreasing at the rate of units for every unit that increases, as illustrated in Figure 29(b).
As mentioned in Section 1.1, the idea of a gradient as a rate of change also applies to curved graphs. For example, you’ve seen that the graph of the equation has gradient 2 at the point with -coordinate 1. This means that, when , the variable is increasing at the rate of 2 units for every unit that increases, as illustrated in Figure 30.
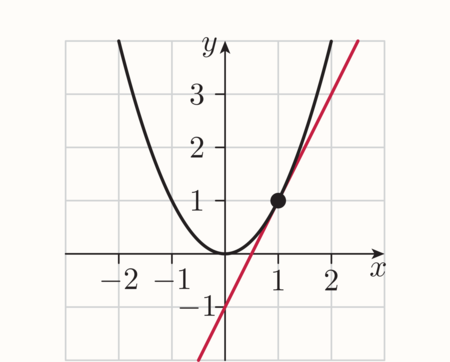
Of course, unlike in Figure 29(a), in Figure 30 the variable doesn’t actually increase by two units for every unit that increases. This rate of change is an ‘instantaneous’ value, valid only for the -value 1. For other values of , the rate of change of with respect to (the gradient of the graph) is different.
Since the gradient of any graph of the variable against the variable is given by the derivative , another way to think about the derivative is that it is the rate of change of with respect to .
As you’ve seen, it’s particularly helpful to think of a gradient as a rate of change when you’re working with a graph that models a real-life situation. In this section you’ll look at two types of real-life situation involving rates of change.