

2.1.1 Production figures
We can find data on the main world producers of cotton from Agricultural statistical offices, and from international organisations such as the Food and Agriculture Organisation (FAO).
If you want to find out more about FAO, or about the Agricultural statistical office in your country, you can search online for their webpages. In what follows, you will be using data from the US Department of Agriculture.
Presenting data in a chart helps to summarise numerical information in such a way that it is visually easy to understand. A bar chart is one example of how this may be done.
Maths skills 1: reading a bar chart
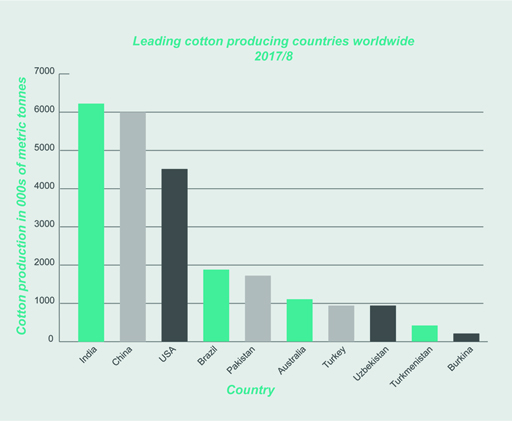
Consider the bar chart in Figure 4. This chart uses data published by the US Department of Agriculture on the leading cotton producing countries across the world in 2017/8. The amount of cotton produced by each country is measured in thousands of metric tons. That is, cotton production is measured by the volume of cotton. Each bar shows how much is produced in thousands of metric tons by each country. This figure can be found by reading from the top of each bar to the vertical, or y, axis.
The benefits of the bar chart are readily recognisable as it is easy to see which countries produce the most cotton. The bar chart does not show exactly the thousands of tons of cotton that each country produces but does clearly show which countries produce the most and by approximately how much.
Activity 6
According to the data presented in the bar chart in Figure 4, which three countries produce the most cotton? Approximately how much does each country produce?
Discussion
The top three leading countries for cotton production in terms of volume are India, China and the USA.
In thousands of metric tons they produce the following volume of cotton: India just over 6000, China close to 6000 and the USA approximately 4500 metric tons.
Again using the data in Figure 4, how does the quantity of cotton produced in India compare to that produced in Brazil?
Discussion
India produces a little more than 6000 thousand tons of cotton compared to just under 2000 thousand tons produced by Brazil, i.e. India produces more than 3 times as much cotton as Brazil. Considering Brazil is the fourth biggest cotton producer by volume this shows the extent of cotton production in India. The USA is the third largest cotton producer and they produce more than double that of Brazil.