
3.1 Value added
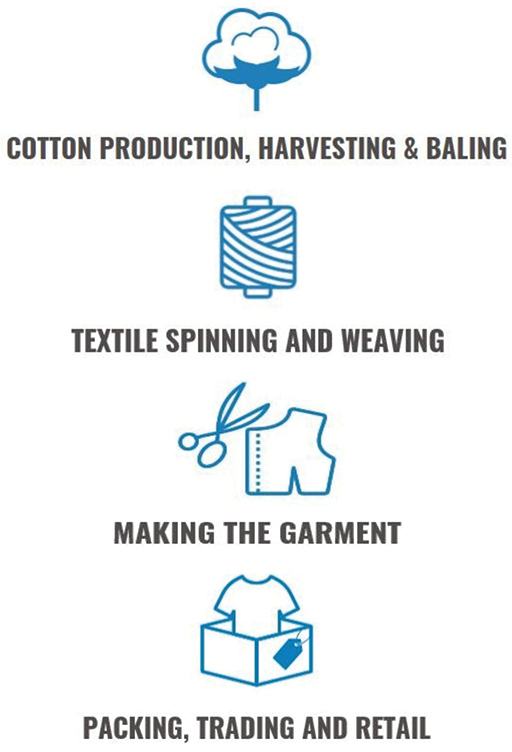
Each stage of the supply chain adds value to the product. For example a spinning factory will buy in cotton and turn it into yarn. This will increase the value of the cotton as the yarn will have a greater value than the raw cotton. Therefore, the value added is the final value of the yarn minus the price the factory managers have paid for the cotton. As the cotton is developed from fibre to woven material and then into the final garment, value is added each step of the way. The aim of this section is to consider how this added value is distributed through the supply chain. In particular, it will investigate whether the value added varies over the supply chain. If so, at what stage is the most value added?
Activity 17
Before reading on, where in the supply chain of cotton do you think the most value will be added?
In a study focusing on the case of Indian producers and UK retailers, Rieple and Singh (2010) estimate the value of a cotton t-shirt at each stage of production. These values are shown in Table 6. In their work Rieple and Singh break down the t-shirt supply chain into more stages than in Figure 3.
Table 6 shows the value of 1 kg of cotton t-shirts as calculated by Rieple and Singh (2010).
| Price (US$) Stages and product |
Selling price of cotton per kg |
|---|---|
| Farming (crop) | 0.56 |
| Ginning (fibre or lint) | 1.29 |
| Spinning (yarn) | 2.56 |
| Knitting (grey fabric) | 3.17 |
| Dyeing and finishing (dyed fabric) | 5.60 |
| Garment stitching | 12.68 |
| Finished garment | 64 |
Footnotes
* 1 kg of t-shirts equates to 4 t-shirtsMaths skill 8: working with decimals 2: subtraction
The subtraction of decimals is carried out using the same process as addition. You should work as if the decimal point isn’t there and then add into the answer in line with the decimal points above.
Without using a calculator work out the following:
1.Subtract 2.42 from 5.76
2.Subtract 2.68 from 6.96
3.Subtract 2.5 from 3.86.
Hint: Use 2.50 rather than 2.5 to ensure that the decimal place is in the correct place in your answer.
Activity 18
In Table 6 the selling price of cotton is $0.56 per kg. Once the fibre has been separated from the seed at the ginning stage this increases to $1.29 per kg. What is the value added at the ginning stage?
Answer
The value added at this stage would be 1.29 - 0.56 = 0.73
Calculate the missing value added figures to complete the table.
| Price (US$) Stages and product |
Selling price of cotton per kg | Value added |
|---|---|---|
| Farming (crop) | 0.56 | 0.56 |
| Ginning (fibre or lint) | 1.29 | 0.73 |
| Spinning (yarn) | 2.56 | |
| Knitting (grey fabric) | 3.17 | 0.61 |
| Dyeing and finishing (dyed fabric) | 5.60 | |
| Garment stitching | 12.68 | 7.08 |
| Finished garment (1kg is 4 t-shirts) | 64 |
Answer
| Price (US$) Stages and product |
Selling price of cotton per kg | Value added |
|---|---|---|
| Farming (crop) | 0.56 | 0.56 |
| Ginning (fibre or lint) | 1.29 | 0.73 |
| Spinning (yarn) | 2.56 | 1.27 |
| Knitting (grey fabric) | 3.17 | 0.61 |
| Dyeing and finishing (dyed fabric) | 5.60 | 2.43 |
| Garment stitching | 12.68 | 7.08 |
| Finished garment (1kg is 4 t-shirts) | 64 | 51.32 |
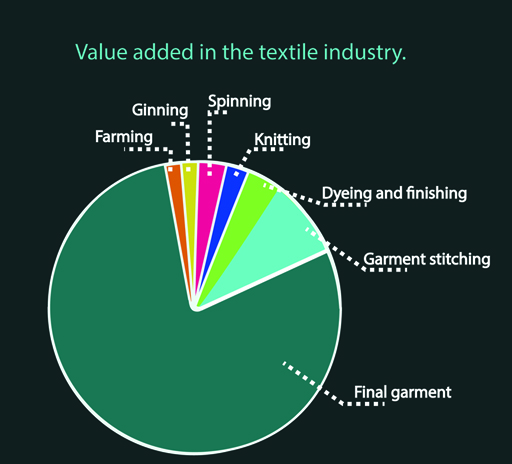
Figure 6 is a pie chart using the value added data from Table 6. A pie chart is a good way of representing this data as we are interested in the share of each part in the total value of a t-shirt.
Activity 19
Use the pie chart in Figure 6 to answer the following questions.
Which stage of the supply chain adds the most value? Which stage adds the least value?
Answer
The most value is added at the retail stage while the least value is added by cotton farmers.
What do you notice about the size of the value added at the earlier stages of the supply chain compared to that added at the later stages?
Answer
The processes at the beginning of the supply chain generally add lower value than those later on towards the final product. There is a very large difference between the value added at the cotton farming and retailing stages. The value added by cotton farmers, $0.56 per kg, is only just over 1% of the value added at the retailer stage, $51.32. [(0.56/51.32) x 100=1.09%]
Overall the value added was largely seen to increase as we moved ‘upstream’ through the supply chain.
Combining the information from Section 4 which highlights those countries most involved at each stage of production and the information above on value added at each stage of production, can we determine which countries benefit the most from the t-shirt production? It seems reasonable to expect that the countries which will gain the most are those who produce at the stage in the supply chain which contribute more to the final value of the t-shirt. And those tend to be European countries and the USA as you saw in Table 5.