

4.4 Prices and industrial change
Many of the new entrants entered by introducing a new variation of the product. In fact, the early period in both industries was characterised by much technological change in the form of product innovation. Once a product standard emerged, product and process innovations around that standard led to a drastic fall in the product price in both industries. We will now look at some of the indicators of this turbulence in technology and prices.
How can we look at price changes over time in industries in which the product undergoes so many changes, especially in the early stages? Economists have devised a way to do just that, called ‘hedonic prices’. These are quality-adjusted prices, that is, prices that keep certain quality characteristics constant. In the case of automobiles over the last decade or so, the price might try to exclude changes such as the emergence of anti-lock brakes, the availability of engines with improved fuel consumption and reduced CO2 emissions, airbags, stronger safety shells, traction control and central locking. In the PC industry, the characteristics to be held constant might include available RAM, processor speed, screen size and weight.
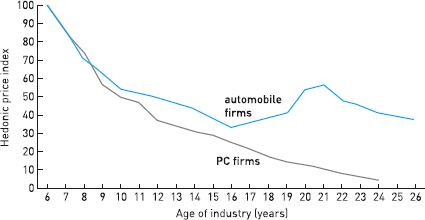
Figure 5 illustrates the evolution of quality-adjusted hedonic prices in both industries. You can see that in both industries prices fell drastically over the first three decades. Between 1906 and 1940, quality-adjusted prices in the automobile industry fell by 51 per cent (i.e. they halved), with most of the change occurring between 1906 and 1918 (Raff and Trajtenberg, 1997). (The quality-adjusted price calculation also removes the effect of inflation.) This fall in price reflects the radical changes in technology, the spread of mass production and the general expansion in the market for cars.
The prices of personal computers were also greatly affected by technological advances. Berndt and Rappaport (2000) found that PC quality-adjusted hedonic prices fell by an average of 18 per cent between 1983 and 1989, 32 per cent between 1989 and 1994, and 40 per cent between 1994 and 1999. Prices began to drop significantly after Intel's introduction of the 32-bit 386 processors in 1985 and the introduction of Windows 3.0 in 1990. The latter allowed the production of PCs to be standardised (via cloning of the IBM PC). The rise of the internet also increased sales and decreased prices. In recent years, quality-adjusted prices have fallen at an average annual rate of 24 per cent (Bureau of Economic Analysis, 2000).
Before we interpret what Figure 5 tells us about prices in the two industries, let me explain the meaning of the numbers on the vertical axis, which shows an index of (hedonic) prices. The concept of an index (plural indices) maybe familiar to you. In case it is not, here is an explanation. It is worth getting this clear, as indices are used a lot in economics. They are basically a simple way of measuring change. The most widely used method of constructing an index is based on the notion of the percentage, as discussed earlier in this chapter (Section 2.2).
Suppose that the price of a product is €5 in 2000, €7.50 in 2001 and €10 in 2002 (just to keep the arithmetic simple). We want to start our index in 2000. So the price in that year is set equal to 100 per cent.
So €5 is the index base =100
Then we compare all the other prices with the index base, using percentages. So to find the index for 2001, we divide the price in 2001 by the price in 2000, and multiply the result by 100 to give us a percentage.
| Year | Actual price of product € | Price index (base 2000) |
|---|---|---|
| 2000 | 5.00 | 100 |
| 2001 | 7.50 | 150 |
| 2002 | 10.00 | 200 |
€7.50 as an index (base 2000) is ![]()
For 2002, we do the same calculation, always comparing it with the base year (2000 in this example).
€10 as an index (base 2000) is ![]()
So Table 1 shows the price index for the three years.
Question 6
Look carefully at Figure 5. What does it tell you about prices in the first three decades of both industries?
(Focus on the slope of the curves, which indicates how prices are changing: a steep downward slope shows rapid price reductions.)
Discussion
Figure 5 clearly indicates that in both industries prices fell drastically during the first three decades. One difference, however, between the two industries is that prices fell for a longer time in the case of PCs. We will examine the reasons for this difference after we have looked at the patterns of innovation.
Exercise 4
Complete Table 2.
| Year | Actual price of product € | Price index (base 2003) |
|---|---|---|
| 2003 | 12.00 | 100 |
| 2004 | 16.00 | |
| 2005 | 19.00 | |
| 2006 | 21.00 |
Answer
| Year | Actual price of product € | Price index (base 2003) |
|---|---|---|
| 2003 | 12.00 | 100 |
| 2004 | 16.00 | 133 |
| 2005 | 19.00 | 158 |
| 2006 | 21.00 | 175 |