

4.5 Technological change
In both industries the fall in prices was driven by radical changes in the production of the products. How might we investigate the technological changes and the changes in quality that occurred in both industries simultaneously with the drastic fall in prices? There are various methods used by economists to measure technological change. Some methods focus on the ‘inputs’ into the innovation process, such as the spending on research and development by firms. But this is not ideal as it does not indicate whether the spending was successful, that is, it does not look at the output of the process, just at the intention. Some methods look at innovative output in terms of the numbers of patents issued by the firms. But this is not ideal either as it does not discriminate between patents which barely affect production and patents which cause major change to the industry. We will use two alternative methods here. One takes into account a list of innovations produced in the automobile industry, where each innovation is given a score according to its effect on the production process of automobiles. The other measures quality change and is derived from the quality-adjusted measure of prices explained above.
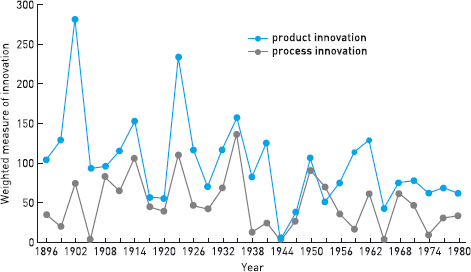
For the automobile industry, Abernathy et al. (1983) compiled a list of all the product and process innovations from 1893 to 1987 and gave each innovation a score on a scale from 1 to 7. This scale is similar to that used by market researchers who enquire how much you like a product on a scale from 1 to 5. The score is called a ‘weight’. A weight of 1 means that the innovation affected the automobile very little (e.g. a new type of colour spray), while a weight of 7 means that it affected it a lot (e.g. the introduction of the assembly line or a new type of engine). The number of innovations per year and their weight produced a score for the year, which indicated the degree to which technological change had occurred. Product and process innovations were listed separately. Figure 6 illustrates this data by plotting the weighted measure of innovation in three-year intervals. The fact that both lines fall over time on average indicates that most product and process innovations occurred in the early years, when the industry experienced a high rate of new firm entry.
Although we do not have the same data for the PC industry, our second measure of innovation can be applied to both industries. This second measure looks at the degree to which the quality of the product has changed over time, a good proxy for innovation as innovation changes the quality of products and processes. To derive this measure of quality change, you start from the index of actual prices of a car or a PC. This is, in essence, the average price of each product sold in stores, turned into a price index as explained above. That is divided by the quality-adjusted hedonic price you have already studied. The first index shows the prices for goods of changing quality; the second, prices for goods of unchanged quality. Dividing the first by the second gives you a quality index: it will be high if there is a lot of quality improvement and low if there is little quality improvement.
Question 7
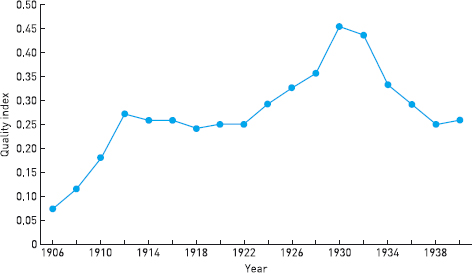
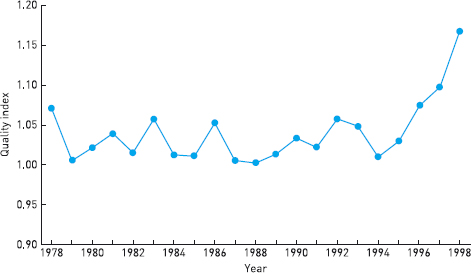
Look carefully at Figures 7 and 8. How do quality changes compare at similar stages in the two industries’ life cycles?
Answer
As in Figure 5, it is the slope of the lines that is important: how the quality index changes over time. A steep upward slope indicates a period of great increase in quality.
One difference between the two industries that you can see if you compare Figures 7 and 8 is that, whereas in the automobile industry the degree of quality change was greatest in the very early years (1906–12), in the PC industry it was greater during the third decade of its existence. This difference is due to the fact that the PC industry emerged from the existing mainframe and minicomputer industry, in which firms such as IBM and DEC controlled the industry and hence had little competitive stimulus to innovate. The reason is that a firm's goal when innovating is to out-perform its competitors; so if it is not being challenged by those competitors, it has less incentive to innovate. Radical innovation was not unleashed in the industry until those firms that had a technical lead lost their control of the innovation process. Innovation up until 1990 was to a large extent controlled by IBM, as everything had to be IBM compatible. Only once the Wintel standard (the combination of the Windows operating system and the Intel processor) replaced the IBM standard, did the industry experience the kind of turbulence experienced in the very early years of the automobile industry. Therefore, although there was a lot of entry into the PC industry during its first fifteen years (as seen in Figure 4), it took longer than that for the new firms to eliminate the lead of the giants that preceded them. Below we shall see the implications of this for the industry structure.
Furthermore, Bresnahan (1998) holds that the reason that technological change in the PC industry lasted into the third decade of its existence, instead of dying off as often happens during the growth stage of the industry life cycle (as in automobiles), is that technological leadership in this industry is not dominated by one firm or a set of firms but divided among firms in different parts of the computer industry. These firms are the makers of PCs themselves (e.g. IBM, Dell, Compaq); the makers of the microprocessors (e.g. Intel); the makers of the operating systems (e.g. Microsoft); and the makers of application software (e.g. Lotus, WordPerfect, Ashton-Tate). This divided technical leadership has ensured rapid advances from specialists and a very competitive market, as PC firms are forced to compete not only with other firms that produce PCs but also with firms that produce parts or complementary products that work with another firms’ products.