Visual representations as aids to thinking
I mention above that co-developing diagrams can be one way to help design and deliver innovative advisory services. The use of visual representations has been mentioned a number of times in this course and we have also used various diagrams to help explain aspects of AgriLink work. This reason for using visual representations in our Living Lab work is explained further through my (Andy Lane) AgriLink Practice Abstract on Using diagrams to help design and deliver Living Labs [Tip: hold Ctrl and click a link to open it in a new tab. (Hide tip)] :
The Living Lab concept is an inquiry process that builds on the principles of design thinking, systems thinking and reflexive monitoring. Design thinking helps to frame the development process. With systems thinking in practice, the process is extended through a process of co-creation with Living Lab partners that involves understanding contexts, inter-relationships, engaging with multiple perspectives and reflecting on boundary judgements.
Consequently, each Lab is unique. Each Lab must be observed, understood, and ‘tailor-made’ interventions must be designed and developed in conjunction with its many participants and stakeholders. This uniqueness also requires reflexive monitoring, where the performance of the Lab is regularly reviewed by participants and stakeholders, and learnings identified and acted upon. Design thinking, systems thinking and reflexive monitoring can all benefit from the use of diagrams or other visual representations as communicative devices, as can all stages in the inquiry process.
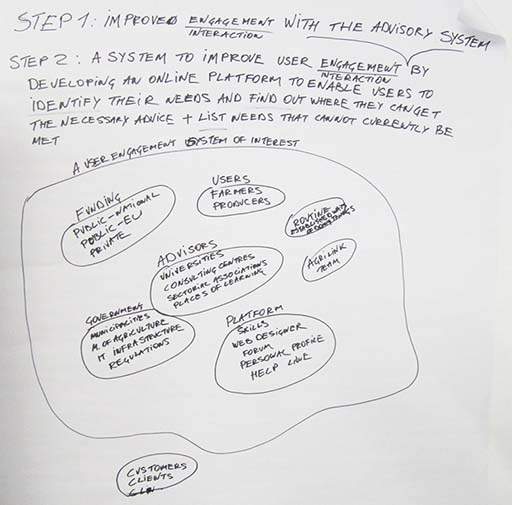
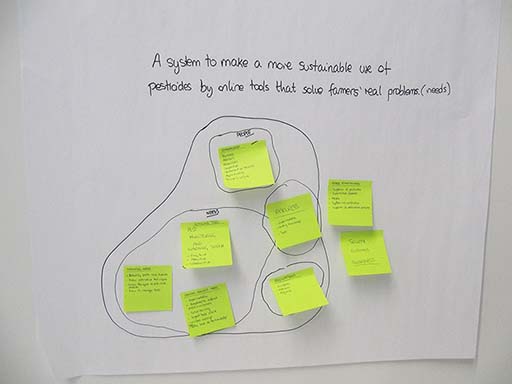
In some cases, this can be a diagram produced by one or more participants for others to comment on, but more often these are diagrams produced collectively on large sheets of paper by groups of participants working together. Thus, diagrams can help frame and focus the discussion. Co-creating it in real time enables everyone to contribute, while the final version provides an unfiltered record of the discussion at that point in time, which can be reviewed or referred to at a later stage in the development of the Living Lab.
In that sense, most of these diagrams are works in progress for co-learning about and testing out ideas and proposals rather than a finalised output, although redrawn versions might be produced for more formal documents (see Figure 4.3).
Systems and complexity in agriculture