Chapter 0.1: Introduction to PoliVisu
This chapter provides a short explanation about the PoliVisu project and its goals.
Data and data analytics have taken the world by storm, catapulting the public sector into a new world of possibilities for policy making. Yet despite a wealth of data being available, many decision makers are still rooted in traditional ways of doing things, making policy decisions based on static models of consultation and closed planning meetings over the time frame of a year or more. As a result, decision making is often siloed and slow, with thinking and solutions out-of-date by the time policy is ready to be implemented.
Shaking up this status quo is PoliVisu, a European Commission funded research and innovation project designed to help policy makers around the world harness the full disruptive power provided by data and analytics to create transparent, collaborative solutions to a range of urban transport challenges. It does so by overcoming two key barriers:
-
Low data literacy: The benefits and risks of data are not always widely appreciated by policy makers outside of specialist data teams, and as a result the use of data in policy making remains low
-
Limited access to advanced technology: As policymakers move towards using data the need for advanced analytical techniques and easy to use tools to extract trusted intelligence from data becomes crucial
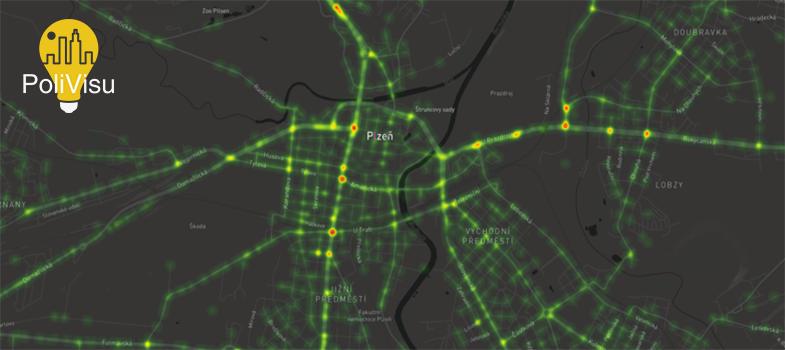
PoliVisu addresses these challenges with policy visualisation tools in the form of dynamic and interactive map based interfaces that not only display data in an easy to understand way but also enables users to simply explore the data, drilling down into details and extracting insights about the situation for themselves.
Video 1: Intro to PoliVisu
Using data visualisation tools, analysis of problems can have greater depth as many layers of data relating to the physical and social world can be considered together. Instead of providing spreadsheets of uninspiring figures to illustrate the impacts of, for example - road routing decisions, visualisations provide a common version of the situation so people of different backgrounds/opinions can explore policy ideas together. Visualising the data can make relationships more apparent, dependencies and interactions can be more clearly viewed and the trade-off between a variety of possible solutions can be modelled and evaluated. As a result of making the data understandable to everyone, policy makers can easily use the visualisations to engage and harness the collective intelligence of policy stakeholders for collaborative and democratic solution development.
Video 2: Guided tour of the PoliVisu website
During the three-year project, several cities, among them Pilsen, Issy-les-Moulineaux, Ghent and Mechelen, have tested the PoliVisu solution to address their own complex mobility challenges, from tackling congestion, to managing road safety and even understanding the mobility patterns of specific groups of people. Results of these tests are woven as case studies throughout the rest of this online course. But first, we invite you to join the forum discussion on the next page to tell us a little bit about yourself.
