

3.3 Jenny’s spending and her goals
In this week, you reach ‘first base’ in managing your money – control over your income versus spending – and linkage of your finances to your life’s ambitions and goals.
When all the options have been weighed up and the necessary adjustments have been made, the final result is a budget showing planned expenditure and income for the following month(s).
In Jenny’s case, after making all of her adjustments to the pattern of her expenditure, her budget might look something like the third column in the table. By listing the budget together with her starting position, it’s easier to see the changes Jenny is planning to make. The new overall difference between income and expenditure is at the bottom of the budget.
| Cash flow (£ per month) | Average month (£ per month) | Budget (£ per month) | ||||
|---|---|---|---|---|---|---|
| NET INCOME | ||||||
| Earnings | Total 1115 | Total 1115 | Total 1115 | |||
| TOTAL NET INCOME | 1115 | 1115 | 1115 | |||
| Rent | 250 | 250 | 250 | |||
| Council Tax | 50 | 50 | 50 | |||
| Regular bills (gas, electricity, water, etc.) | 30 | 60 | 50 | |||
| Telephone (mobile and landline) | 40 | 40 | 30 | |||
| Home insurance (contents and building) | 12 | 12 | 10 | |||
| Household goods | 15 | 30 | 30 | |||
| Food and non-alcoholic drinks | 150 | 150 | 120 | |||
| Alcohol | 40 | 40 | 40 | |||
| Tobacco | 30 | 30 | 0 | |||
| Clothing and footwear | 50 | 50 | 40 | |||
| Medicines, toiletries, hairdressing (personal) | 30 | 30 | 30 | |||
| Going out | 120 | 120 | 80 | |||
| Holidays/other leisure | 20 | 100 | 50 | |||
| Motoring costs (insurance, petrol) | 70 | 130 | 180 | |||
| Birthday presents/charity/other gifts | ||||||
| Christmas presents/gifts | 10 | 45 | 30 | |||
| Personal loan repayments | 100 | 100 | 100 | |||
| TOTAL EXPENDITURE | Total 1017 | Total 1237 | Total 1090 | |||
| SURPLUS/DEFICIT | 98 | -122 | 25 | |||
Compare Jenny’s budget (shown in the budget column) with her previous pattern of spending (shown in the average month column) in the table. What things is she spending more on, and what is she spending less on? Do you think this budget will help her to meet her goals?
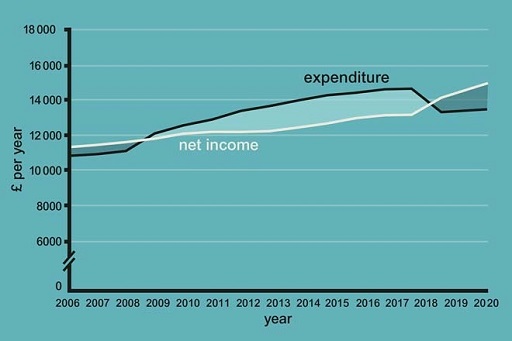
The impact of Jenny’s decisions can be seen in the graph, showing her moving from a deficit to a surplus on her budget, which she intends to maintain in the future.