
5 Illiteracy – a criminal problem?
From the 1830s to the 1850s, prisoner literacy data was used by policymakers to shed light on the spread and quality of popular education in England and Wales and to guide their interventions. In 1856, the introduction of a new series of national criminal statistics – the Judicial Statistics – which continued to include prisoner literacy data reaffirmed the commitment of civil servants and penal administrators to the collection of this information. However, doubts emerged about how useful this data would be to the outside world.
From 1839, annual reports of the Registrar General for Births, Deaths and Marriages included the number of brides and grooms who had signed the marriage register with a mark (for example, an X), indicating that they could not write, and therefore were illiterate. By counting these marks, the first report published in 1840 estimated that 67% of males and 51% of females in England and Wales were literate. As an annual measure of population literacy for the whole country which was free from ‘observer bias’, marriage registers superseded other forms of measurement, such as prisoner literacy (Vincent, 2014).
The late 1850s witnessed the passing of a generation of prison chaplains who had played a leading role in the interpretation of prisoners’ educational attainments. In 1861, the advent of the Revised Code – a new system of instruction in reading, writing and arithmetic introduced in state-subsidised schools – generated a new scheme of graded literacy and numeracy for policymakers and reformers to experiment with. Prisoner literacy rates were notably absent from debates surrounding the establishment of a universal system of elementary schooling in England and Wales in 1870, and the advent of compulsory elementary education in 1880.
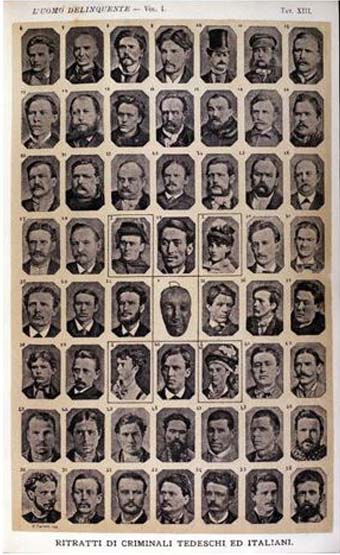
However, in the 1880s prisoner literacy rates found a new audience: positivist criminologists. Whereas previously, crime had been regarded as a choice committed by immoral individuals, positivist criminologists argued that the criminal was fundamentally different from law-abiding citizens.
He or she was the product of external forces which acted on his or her will; for example, their physical environment, or their physical and mental constitutions. Crime was not committed by immoral individuals who shunned honest labour. It was the result of ‘inherited or physical deficiency’ (Bailey, 2019, pp. 19–20; Wiener, 1990, pp. 236–44).
Activity 3 Interrogating the statistics
The Rev. William Douglas Morrison, chaplain at Wandsworth Prison, was heavily influenced by positivist criminology. In his book, Crime and its Causes (1891), Morrison used data on population literacy from the marriage registers and data on prisoner literacy from the Judicial Statistics to investigate the relationship between crime and illiteracy.
He drew attention to the fact that, in 1881–84, while 85.5% of the general population could read and write (as he gleaned from marriage registers), 72% of prisoners could only read and write imperfectly and 25% could not read and write at all. The difference, he claimed, could not be explained by the defective early training of the prisoners. Instead, it showed that:
… a certain number of criminals are almost incapable of acquiring instruction. The memory and reasoning powers of such persons are so utterly feeble that attempts to school them are a waste of time.
Part 1
Consider the following question:
- Can you see any flaws in Morrison’s comparison of these two data sets?
Discussion
Morrison’s comparison of data derived from marriage registers with prisoner literacy data could be regarded as based on unreasonable assumptions. A groom or bride was considered literate if he or she could write their name in the marriage register. This does not mean that they could read and write well; it is entirely possible that they could only read and write imperfectly.
Furthermore, the marriage registers provided a snapshot of the literacy of men and women of marital age, overwhelmingly 21 to 30 years. The prison population included males and females from a wider age range and, after 1879, an increasing proportion aged over 30.
Part 2
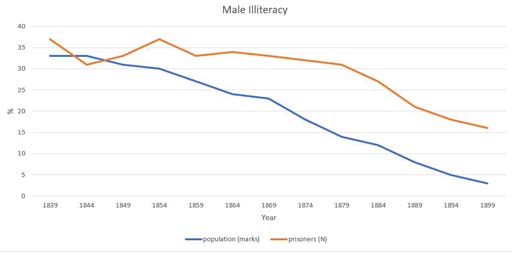
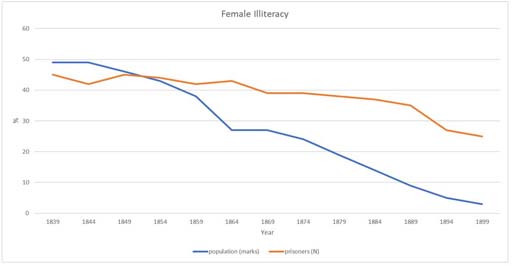
Now take a look at the two graphs (Figures 7 and 8) below which compare, respectively, the proportion of grooms and brides who signed the marriage register with a mark with the proportion of those committed to prison who could neither read nor write.
- Are there any trends in these graphs which could be used to challenge Morrison’s conclusions?
The following advice on reading graphs might be helpful. Have a look at the titles of each of the graphs and at what is being represented. Along the horizontal axis, known as the x axis, is time. The y axis, which is vertical, indicates percentages from 0 to 100. One way to remember which is which, is that the letter y has a tail hanging down so the y axis is the one which runs down. The letter x is also a cross so the x axis runs across the page.
Check that the divisions are equal, for example that one centimetre represents 10 years. Sometimes this is not the case. If the data covers a large range of values then sometimes another type of scale is used. Note that there are graphs where the y-axis doesn’t start at 0. Before you decide on the data you wish to discover, take a look at the general trends being depicted.
Discussion
It is notable that in the 1880s and 1890s – following the advent of compulsory education in England and Wales – the proportion of illiterate male prisoners and illiterate female prisoners began to decline at a rate similar to that of illiterate grooms and brides. This finding could be used to challenge Morrison’s conclusions. It suggests that while prisoners might, on average, have been more illiterate than the general population, they were not, on the whole, hopeless causes who – through some inherited or mental deficiency – could not learn to read and write.
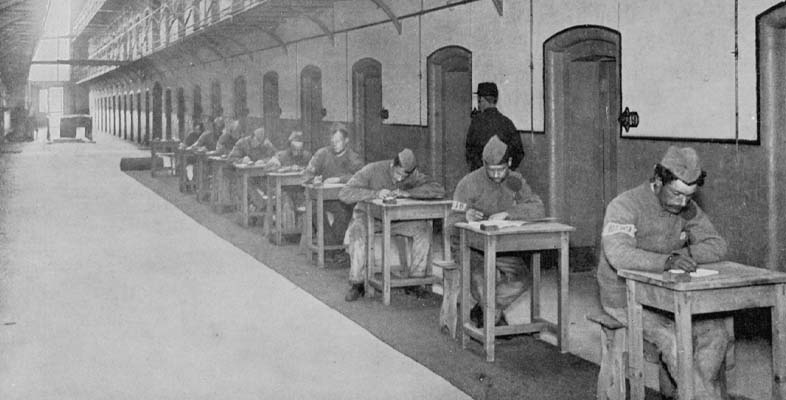
There were many reasons for prisoner illiteracy in the late 1800s. Some prisoners did struggle to learn to read and write, possibly because they had special educational needs. After around 1850, chaplains and penal administrators were becoming more aware of ‘mental incapacity’ as those who could not read and write were increasingly forced to learn in prison. There were some limited attempts to cater for those with learning disabilities. A small number of prisoners were excluded from school after being ‘diagnosed’ as incapable of learning.
There were also many prisoners who had not attended school, even after the advent of compulsory education. Elementary schooling did not become free until 1891. Sending a child to school deprived the household of their financial contribution. Many who did attend school left at about age 11, the limit of compulsory education, with little more than a basic competence in reading, writing and arithmetic. If these skills were not used regularly, they deteriorated.