

4.2 A complex decision tree – deciding whether or not to launch a product early
From the last worked example, you should now have a good understanding of the basics of how decision trees work. In this next example in Activity 6 you will meet a more complex decision tree with more than just the initial decision node. In other words, more than one decision will be needed. Thus, as well as providing an initial decision (what to do now), the decision tree will also provide a strategy for future decisions depending on the outcomes of various chance events.
Activity 6 Example of a complex decision tree: considering early launch of a product
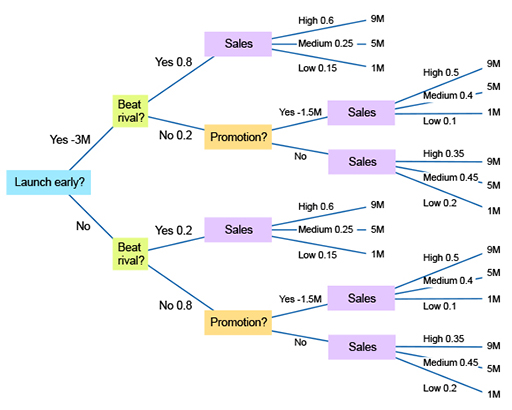
A company is planning on launching a new product. It was thinking of launching in June of next year but it believes that a rival is also considering launching a similar product around that time. The company is considering bringing the launch forward to the end of this year. This will cost an extra €3M to carry out and the company believes it will have a 0.8 probability of beating the rival to the market. If, however, they wait until June, the probability of beating the rival falls to 0.2.
To make the decision easier, the company assumes that sales will be either high, medium or low. If the company launches before its rival, the probability of high sales is 0.6 and the probability of medium sales is 0.25. If it launches after its rival, the probability of high sales falls to 0.35 and medium sales rises to 0.45. If the rival launches first, the company could undertake a sales promotion, costing €1.5M, but would change the probabilities of high sales to 0.5 and medium to 0.4.
The financial impacts are that high sales would be worth €9M, medium would be worth €5M and low, €1M.
Using a decision tree analysis, calculate what the company’s investment strategy should be. You can use pen and paper, an Excel spreadsheet, or record your calculations in the text box below.
Once you have arrived at a solution, watch Video 5 for the feedback of this activity.
Discussion
Now watch Video 5.

Transcript: Video 5 Solution for considering the early launch of a product
You may find it useful to work through the written solution below too. In this more complex decision tree you had to make some subsequent decisions based on the final outcomes of each branch. Thus you not only arrived at an initial decision (what action to take now) but also what actions to take at future points based on future chance events.
Written solution
You can also read the solution below.
The decision tree is shown in Figure 7.
The calculations for each node are as shown in Table 9 (remember that you will need to work from right to left).
Expected sales
| Sales’ node number (from top to bottom of decision tree) | Expected sales – calculation €M | Expected sales – value €M |
|---|---|---|
| 1 | (0.6 × 9) + (0.25 × 5) + (0.15 × 1) | 6.8 |
| 2 | (0.5 × 9) + (0.4 × 5) + (0.1 × 1) | 6.6 |
| 3 | (0.35 × 9) + (0.45 × 5) + (0.2 × 1) | 5.6 |
| 4 | (0.6 × 9) + (0.25 × 5) + (0.15 × 1) | 6.8 |
| 5 | (0.5 × 9) + (0.4 × 5) + (0.1 × 1) | 6.6 |
| 6 | (0.35 × 9) + (0.45 × 5) + (0.2 × 1) | 5.6 |
Expected sales after promotion
There are two promotion decision nodes, as summarised in Table 10.
| Promotion node number (from top to bottom of decision tree) | Expected sales after promotion – calculation €M | Expected sales after promotion – value €M |
|---|---|---|
| 1 – Yes | 6.6 – 1.5 | 5.1 |
| 1 – No | 5.6 | 5.6 |
| 2 – Yes | 6.6 – 1.5 | 5.1 |
| 2 – No | 5.6 | 5.6 |
At both decision nodes, the expected value of sales is higher without the promotion than with it. The company will, therefore, never promote if launching after its rival. The higher figure of expected sales (€5.6m) is now carried forward.
| ‘Beat rival’ node number (from top to bottom of decision tree) | Expected sales – calculation €M | Expected sales – value €M |
|---|---|---|
| 1 | [(0.8 × 6.8) + (0.2 × 5.6)] − 3 | 3.56 |
| 2 | (0.2 × 6.8) + (0.8 × 5.6) | 5.84 |
You can see from Table 11 that the value of launching early is €3.56M, whereas the value of not launching early is €5.84M.
Thus, the decision is two-fold: the company should not launch early. If it then finds that it has not beaten its rival, it should not undertake a promotion.
In the next subsection you will consider another example of a complex decision tree, this time related to the launch of a new pharmaceutical drug.