2 Pattern 1: Focus on the outcomes
What are BVSSH outcomes?
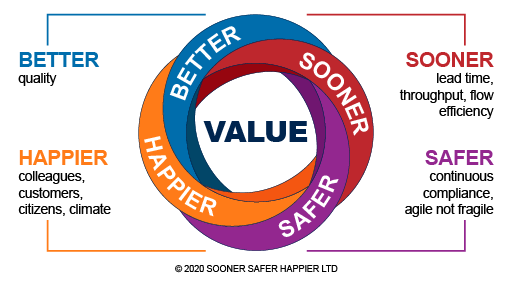
(B)etter is quality. Quality that is built in rather than inspected in later. There are fewer incidents and outages and less rework. More time is spent proactively rather than reactively. Improving quality can be demonstrated through, for example, continually reducing trends of breaks/data exceptions/outage, increased mean time between failures and reduced time to recovery. A wide range of metrics is available to demonstrate quality trends, depending on your context.
(V)alue is unique; it is an outcome of value to your organisation, and it is your purpose. It could be financial; it could be maintaining public safety; it could be charitable. As the future is not knowable, value is articulated via outcome hypotheses with leading and lagging measures.
The leading measures act as an early indicator, an early feedback loop, based on whether we are seeing the desired behavioural shifts happening. This enables pivoting and agility in order to maximise the outcome or have the cheapest cost of failure.
The lagging measures will align more closely to impact metrics and more traditional benefits statements.
(S)ooner is time to market; time to learning, to pivoting, to de-risking, to avoiding a ‘sunk cost fallacy,’ to locking in progress and value early and often. There are three key measures:
Lead Time is the time from starting work on an item of value to getting it into the hands of a customer.
Throughput is the count of items of value delivered into the hands of a customer in a time period. As lead time comes down, throughput should go up.
Flow Efficiency is the percentage of time that work is actively being worked on during its elapsed end-to-end lead time, as opposed to waiting to be worked on. For most large, service-based organisations, flow efficiency is typically 10% or lower. This means that work is waiting at least 90% of the time. This is where significant gains can be made. Focus on where the work isn’t, not where the work is.
(S)afer is Governance, Risk, and Compliance (GRC), information security, data privacy, regulatory compliance and resilience in chaos, be that a cyber-attack or a global pandemic. It is customers trusting your organisation.
(H)appier covers customers, colleagues, citizens and climate, as it is not about ‘more for less’ at any human or climatic cost. It is high levels of customer advocacy and colleague engagement with a positive impact on society and the one planet we live on.
Together, Better Value Sooner Safer Happier balance each other. If Sooner is achieved by working people harder or cutting corners, the result will be a reduction in Better, Safer and Happier.
When establishing BVSSH measures, it is important to look at the trends over time, the vector metrics, rather than absolute values. What matters is not the specific metric you use, nor the level you or your team are at, but rather that teams are monitoring and seeking to continually improve their performance along these dimensions. Think ‘personal bests’, not ‘I’m the best’.
BVSSH contains two types of outcome:
Better Sooner Safer Happier are the how outcomes. They measure the improvement in your system of work.
Value is the what, the ‘business’ outcome hypotheses that the system of work produces.
The two sets of outcomes form a virtuous circle, as illustrated in Figure 1.
Improvements in the how lead to improvement in the what due to faster feedback, the ability to pivot, higher quality and more engaged colleagues and customers. Rather than inflicting one set of practices, focus on BVSSH and empower teams to improve using their own brains, with support, in their unique context. With incentivisation and psychological safety, this will build a new muscle memory, a continuously learning and improving organisation.

