

2.2 Value Stream Mapping
In the following video, Myles Ogilvie introduces Value Stream Mapping, a powerful technique to help you to understand how to measure and continually improve flow.
Transcript
Figure 3 illustrates how to measure the flow efficiency when queuing for a cup of coffee. In this case, the flow efficiency is 20%, meaning you spent 80% of the time waiting.
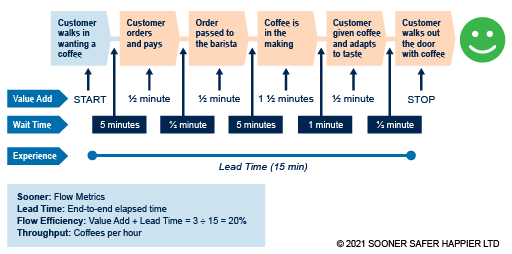
As Myles Ogilvie explained in the video above, the wait time is when work is not happening. There are many different reasons work stops. Using the language of astronomy, the wait time could be considered the ‘dark matter’ of your system of work. By visualising and tackling this wait time, you can achieve radical performance improvement.
In most large organisations where there has been no historic focus on optimisation, the flow efficiency associated with work is below 10%: in other words, for over 90% of the time, work is waiting in queues. In order to improve the flow of value through your organisation, you will need to:
visualise the flow,
identify the wait times and bottlenecks and
evaluate where the best place is to apply improvements.
Large organisations are complex and adaptive – as their people and environment shift, there can be a steady increase in disorder (entropy). A continual improvement approach to improving flow is advisable – improving ways of working is not a one-off exercise. The Law of Marginal Gains [Tip: hold Ctrl and click a link to open it in a new tab. (Hide tip)] (the belief that small improvements to any process amount to a significant improvement when added together) means that many small improvements over time can lead to extraordinary outcomes.
Activity 2: Value Stream Mapping
Try applying Value Stream Mapping to a process at your organisation.
- Using a whiteboard or a digital canvas, draw a horizontal line from one side to the other.
- At each end, place a sticky note (or a text box) explaining the start and end of the process you wish to improve.
- Between these, place another sticky note (or text box) describing each step of your process. Use the same colour notes for all of these. On each sticky note, write the time it takes to execute the tasks.
- Now add a different-coloured sticky note between each of the process steps you have just created and write the wait time on it.
- Finally, normalise the units you have used (seconds/minutes/hours/days/weeks/months) and calculate the flow efficiency of your process.
As you map your process, reflect on the following questions:
What are the major impediments to flow in this process, the main sources of wait time?
In order to accelerate flow, what do you want to tackle first?
The business agility patterns described in the next sections are fundamental enablers for improvements in Better Value Sooner Safer Happier outcomes within your organisation. Brief summaries are provided, but further information about these patterns can be found on YouTube at https://soonersaferhappier.com/ and in the published text Sooner safer happier, patterns & antipatterns for business agility (Smart, 2020).