1.7 Increasing complication, complexity and risk: a spectrum of systems intractability
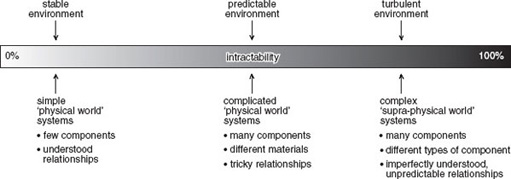
Summarising the discussion in the previous two sections, Figure 12 shows what might be termed ‘a spectrum of systems intractability’. At one end of the scale are simple systems. These are easily understandable and their design and development (relatively) unproblematic. The way in which the various elements in the system fit and work together is clear. Outputs and behaviours are predictable. An example of a simple system is the table shown in Figure 13.

The table is constructed from 42 parts made from three types of material and manufactured using different processes:
-
top – made of plywood
-
veneer for surface and edges of top (wood)
-
four plywood legs consisting of two glued components
-
twenty-six cross-headed screws
-
two metal fixings for securing one table to another.
While the table can be regarded as a system itself, it may also be useful to think of it as part of the ‘presentation’ room system shown in Figure 14.
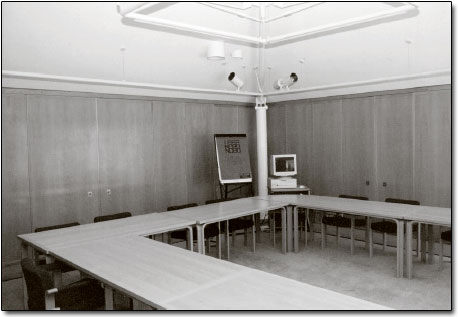
The number of elements in this system has increased enormously. There are, for example, 12 tables in the room. Each of the 20 chairs has 53 separate components but an additional level of complication is introduced by the personal computer, the projector, the hardcopy projection device and the links between them. The relationship between the components of the table is mechanical, that between the tables and chairs spatial, but that between the projector and the personal computer is both physical (through the wires) and informational, expressed through various layers of software. If each table can be viewed as a simple system, the presentation room as a whole has become complicated. It is not complex since its elements can be understood and the relationships between them defined. The behaviour of the system shown in Figure 14 is predictable since it is static.
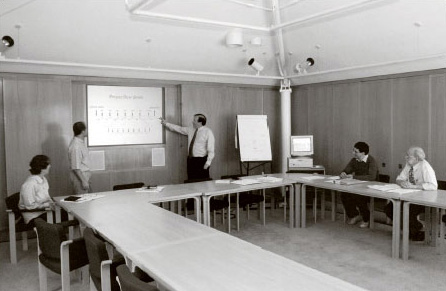
Figure 15 shows the presentation room system with the addition of people to produce what might be labelled a ‘learning system’. The addition of people to the presentation room turns it from a static system to a dynamic one, and its behaviours from predictable to unpredictable. The result is to push the system towards the right in the spectrum shown in Figure 12. It has become complex rather than being merely complicated.
As the examples illustrated in Figures 9 and 13–15 suggest, the factors that increase complication, and hence complexity, are as follows:
-
The number of separate components in the system. A greater number of components leads to increased complication.
-
The variety of components in the system. The component parts in the ‘table system’ are made from only three different types of material.
-
The nature of the relationships between the components. In the table system the relationship between the parts was mechanical and chemical (the adherence of the veneers to the plywood top), whereas in the learning system the types of relationship are, in addition, electrical, electronic, informational and psychological.
-
The degree of coupling between the parts of the system. The various parts of the table were tightly coupled one to another, but the coupling of some of the components of the learning system is a great deal more loose. The way that, say, the application software in the personal computer interacts with its operating system may not be fully denned, leading to the (all too familiar) system crashes; the interaction of the computer with the projection equipment often has a degree of uncertainty. However, the elements in the system that exhibit the loosest coupling are often the human beings in their interaction with the non-sentient elements of the system and their relationship with one another. For example, the replacement of human workers with automation will increase the coupling of the system.
-
The degree to which the operation of the system is dynamic. In a static system, like the table, the relationship of the parts is necessarily fixed. The functioning of the table (as a table rather than, say, a barrier) demands that the relationship of its parts is stable and that it exists in a certain aspect to the floor of the room. The relationship between factors 1–3 listed above and complexity is positive.
-
The degree to which the system is robust in the face of variations in its environment. Systems maintain a degree of integrity when confronted or challenged by changes in their environment. They have a designed in or learned ‘envelope of robustness’. Thus, the wristwatch shown in Figure 10 proclaims that it is ‘shock resistant’ and ‘water resistant to a depth of 30 metres’. In addition, its self-winding mechanism provides it with a power reserve of about 40 hours. The robustness of the watch was designed in; other systems – particularly those in which the human element is significant – exhibit learning, which increases robustness. A robust system is more predictable and, therefore, less complex than one which is not as robust.
Box 3 Ants at the edge of chaos
Most people would regard ants as relatively simple creatures but, as a series of experiments undertaken during the mid-1980s demonstrated, their behaviours, when viewed at a system level, can produce surprising and unexplainable outcomes.
The design of the experiments was simple. First take a nest of ants. Second, place two identical piles of food equidistant from the entrance to the nest. Third, replace grains of food that are removed from the piles so that they remain identical. The question is: once the ants are released, will they all go to one source of food, or divide themselves in some proportion between the two piles?
Since there was no reason for an individual ant (so far as is known) to prefer one food pile over the other, it might be expected that the colony would divide itself evenly, roughly half going to one pile and the remainder to the other. Each ant emerges from the nest, mentally tosses a coin, and makes for one pile or the other. Having been successful and the food pile remaining constant, the ant has no reason to change its behaviour.
However, it is known that an ant, having successfully found a source of food, will pass on the good news to others and try to persuade them to follow it by a chemical secretion. Successful behaviour is reinforced by this means and a positive feedback loop established.
The result should be that eventually all the foraging ants are persuaded to visit just one of the food piles or that the proportions might settle down to be different from a 50:50 split, the exact ratio being established by variations in the foraging pattern.
‘In fact what was seen to take place was a completely different outcome. Even when the experiment had been running for some time, in ant terms, the proportion of the ant population visiting any one site continued to fluctuate in an apparently random fashion. The proportions averaged out at one half, but this precise outcome was hardly ever observed, and the proportion was subject to constant change. Once a large majority of ants had visited one of the sites, the outcome tended to stay reasonably stable and exhibited small variations around that proportion for some considerable time. But the majority was always eroded and the ants switched to visiting the other site. Sometimes these shifts were not only very large – from, say, an 80:20 division at one pile to the reverse outcome of 20:80 – but also rapid.’
The experiments were varied to see whether a different outcome could be induced. Different species of ants were used with no difference. To eliminate possible differences in the food sources a single pile was used. Two separate bridges were set up at identical distances from the entrance to the nest and the numbers of ants crossing each were counted. Again, the results replicated the original experiments.
The behaviour of the ants was of interest not only to biologists, and Alan Kirman, then at the European University Institute in Florence, began to look at the problem from a different view point.
‘Kirman set up a theoretical model which gives an excellent account of the observed behaviour of the seemingly perverse ants […] An ant coming out of the nest follows one of three possibilities: it visits the food pile it previously visited; it is persuaded by a returning ant to visit the other source; or, of its own volition, it decides to try the other pile itself. And this is almost all that is required to explain the complex and seemingly baffling phenomenon of the fluctuations in the proportions of ants visiting the respective piles.’
The greater the value of the factor, the more complicated and complex the system being considered or designed. In the case of what I have termed the degree of coupling, the tightness of coupling is inversely correlated with complication and complexity. The six factors combine to determine, in part, the degree to which the behaviour of the system and its outcomes are unpredictable. This, in turn, influences the extent to which the system is complex rather than complicated or simple. A degree of dynamism is shown by the watch in Figure 10. In this system the functioning depends on the parts moving in relation to one another in a predetermined and predictable way. The inclusion of sentient creatures within the boundary of a system introduces a greater degree of dynamic behaviour. Even when these creatures may be regarded as relatively programmed or ‘hard-wired’ in their reaction to stimuli the dynamic behaviours that result from their interaction can be unexpected and initially unexplainable, as the example given in Box 3 suggests. However, perhaps it is our expectation which is the problem rather than the behaviour of systems themselves. We should anticipate variation, and as the current saying is, we should ‘Learn to expect the unexpected.’
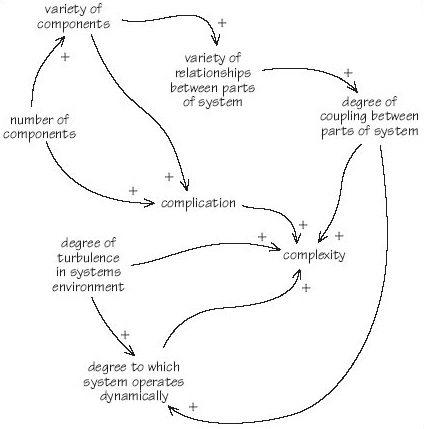
SAQ 5
Draw a multiple-cause diagram that identifies the various relationships involved in complication and complexity.
Answer
My diagram looked like Figure 16.