5.1.3 Using a checklist
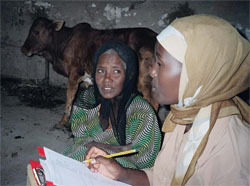
As a Health Extension Practitioner you may need to use checklists to observe performance and recognise problems in work standards (Figure 5.5). A checklist is a set of criteria that you can prepare to assist you in monitoring your own activities. A checklist can also be a record or a reminder of what has been happening so that you can follow the progress you are making. This will help you to trace the causes of any work problems. Problems may be caused by personal, administrative, technical or organisational difficulties. For example, receiving expired drugs is a technical fault.
Case Study 5.1 Monitoring vaccination coverage rates
In kebele X the objective for this year is to vaccinate 85% of the children under six months of age with oral polio vaccine (OPV).
There are a total of 550 eligible children in the village, so the target figure is 85/100 x 550 = 468 children to be vaccinated in the year.
The monthly checklist for vaccination of these children is shown in Table 5.1. The first column shows the number of children who have been newly vaccinated each month. The second column is a cumulative total of the actual number of children vaccinated to date. The checklist records the monthly figures for the past six months and you can see that 263 eligible children have been vaccinated so far.
This number can be compared with the target of 85% of all 550 children, which is 468, to see whether the work is progressing as expected.
| Months | Number of children vaccinated each month | Cumulative total number of vaccinated children |
|---|---|---|
| January | 20 | 20 |
| February | 23 | 43 |
| March | 35 | 78 |
| April | 50 | 128 |
| May | 55 | 183 |
| June | 80 | 263 |
Looking at the monthly checklist in Table 5.1, is the trend of numbers of children being vaccinated increasing or decreasing?
If the current trend continues over the next six months, will you achieve your target? Explain how you would show this in your report.
Yes, the figures in the table show an increasing trend over the last six months of newly vaccinated children under six months of age. In January only 20 children were vaccinated, while four times this number (80) were vaccinated in June.
Comparing what has been achieved (263) with what has been planned (468) you can calculate that a vaccination target of 57% has been achieved in the first six months (263/468 x 100 = 57%). This shows that if the current trend continues, you are likely to achieve the target of 85% by the end of the year.
5.1.2 Methods of gathering information for monitoring