15.3.3 Stratified random sampling
Sometimes you may need to include some small groups in your sample. For example, random or systematic sampling may not select enough individuals from under-represented subgroups for your research. How do you ensure that small groups are included in sufficient numbers to make the research valid? In such cases you may use a stratified sampling method. Stratified random sampling involves dividing your population into various subgroups and then taking a simple random sample within each group. This will ensure that your sample represents key subgroups of the population. Figure 15.4 illustrates this process.
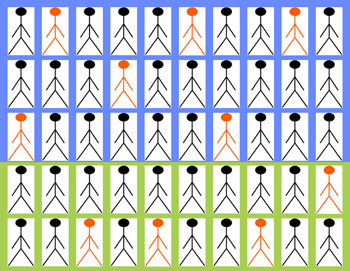
The 50 subjects in Figure 15.4 have been stratified (divided) into two subgroups – one of 30 subjects (outlined in blue), and one of 20 subjects (outlined in green). A sample of 10 subjects has been selected, but they have not been picked entirely at random. Instead, 6 have been selected at random from the 30 blue subjects and 4 have been selected at random from the 20 green subjects, to ensure that the blue and green individuals are proportionately represented in the sample of 10 selected individuals.
Representation of the subgroups can be proportionate or disproportionate. For example, if you wanted to sample 100 farmers from a population of farmers in which 90% are male and 10% are female, a proportionate stratified sample would select 90 males and 10 females. But you may want to know more about the women farmers than is possible in a sample of only ten subjects. So you can select a disproportionate stratified sample, for example, you could select 50 males and 50 females. The example in Case Study 15.3 will help you to understand stratified sampling.
Case Study 15.3 Stratified sampling of households
A survey is conducted on household water supply in a district comprising 2,000 households, of which 400 (or 20%) are urban and 1,600 (or 80%) are rural. It is suspected that in urban areas the access to safe water sources is much more satisfactory than in rural areas (Figure 15.5). A decision is made to sample 200 households altogether, but to include 100 urban households and 100 rural households.
Is this sample a proportionate or a disproportionate stratified sample?
It is disproportionate. 100 urban households out of a total of 400 means that 1 in 4 (one quarter) of the urban households were included in the sample. 100 rural households out of a total of 1,600 means that only 1 in 16 rural households were sampled.

15.3.2 Systematic sampling