1.1 Periodic signals
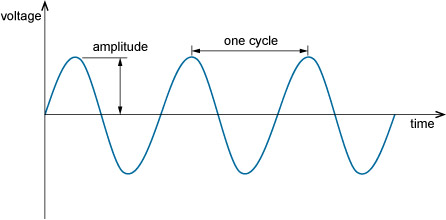
Fundamental to communications is the analogue signal known as the sinusoid or sine wave, shown in Figure 1.1. Sinusoids are important not only because they turn up naturally in a wide variety of situations, but also for their mathematical simplicity. Figure 1.1 shows a sinusoidal changing voltage, but other properties can change in this way, such as current, power, pressure, and so on.
A sinusoid is an example of a periodic signal. It repeats at regular time intervals. Any non-sinusoidal periodic signal can be regarded as a sum of sinusoids.
A section of a periodic signal between two consecutive maxima (or any other corresponding points) is called a cycle. The duration of a cycle is the period. The number of cycles in one second is the frequency. The unit of frequency is the hertz (Hz), where 1 Hz = 1 cycle per second. If f is the frequency in Hz and T is the period in seconds, then:
and
Also shown in Figure 1.1 is the amplitude, the maximum value of the sinusoid.
Activity 1.1 Self assessment
A sine wave has a frequency of 25 000 Hz (25 kHz). What is its period?
Answer
T = , so T = s = 0.00004 s or 40 µs.
Sinusoidal signals also have phase. This relates to the part of a cycle that the sinusoid has reached at a particular time. In Figure 1.1, for example, at zero time the signal is zero and rising. Shifting the signal to the right or left changes its phase. Phase is measured in degrees or radians, and ranges from 0° to 360° (0 to 2π radians).
Activity 1.2 Exploratory
This activity demonstrates how a sinusoid can be generated, by measuring the height of a rotating line.
It will allow you to explore the different features of the sinusoidal waveforms you have just been reading about, so that you can become more familiar with how sinusoids can be created and what happens when the different properties of sinusoids are altered.
The activity has been pre-loaded with the required settings to create a basic sine wave. When you click on ‘Generate’, you will see how a sine wave can be created by rotating a line of length a at a constant speed about a fixed point O. As the line rotates, you can see how the variation of the line marked y plotted against time traces out the shape of a sine wave. The frequency, amplitude and phase of the sinewave can be changed using the sliders at the top. Changes can only be made when the rotating line is stopped.

