The power of infographics in research dissemination
Introduction

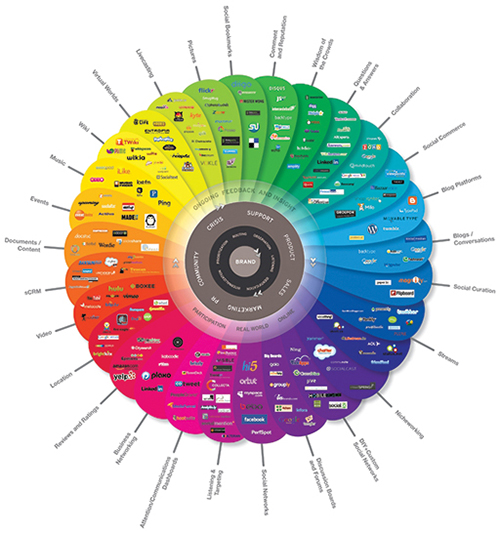
Infographics are becoming an essential tool in data representation, sense-making and research communication. In this free course, The power of infographics in research dissemination, you will explore when and how infographics can be useful to your work. You will look at some good and bad practice in making and using infographics and will learn how to evaluate infographics that appear to be presenting research evidence. The course concludes by introducing you to free resources that can help you produce effective infographics of your own and to critically evaluate the infographics of others. A key focus of this course – and the postgraduate Open University module on which the course content is based – is developing your skills and understanding as a critical researcher.
This OpenLearn course is an adapted extract from the Open University course H819 The critical researcher: educational technology in practice.
