

2 Visualising data
Infographics – graphical representations of abstract data – can serve two purposes:
- data analysis and sense-making
- communication.
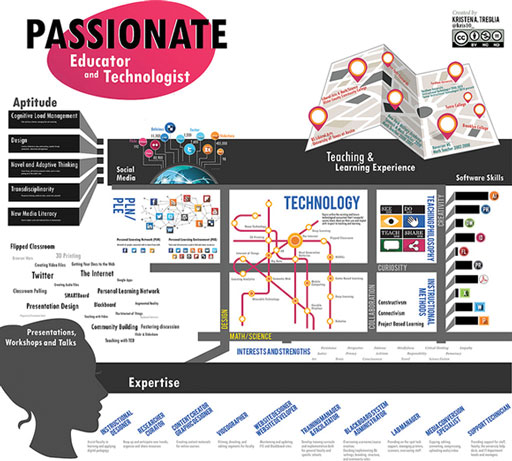
Infographics can be fabulous, beautiful, powerful fusions of art and data that are well suited for disseminating through social-media channels, such as Facebook and Twitter, where images work particularly well. They also get some terrible press. The article ‘Ending the infographic plague [Tip: hold Ctrl and click a link to open it in a new tab. (Hide tip)] ’ gives examples of some of the ‘terrible, lying infographics, which have become endemic in the blogosphere, and constantly threaten to break out into epidemic or even pandemic status’ (McArdle, 2011).
In this short course, you will encounter the good, the bad and the absolutely stunning in the world of infographics. You will explore ways to evaluate the accuracy and effectiveness of infographics that are being used to present research data, as well as investigate good and bad practice in infographic design.