3 Benefits of the Body Mass Index
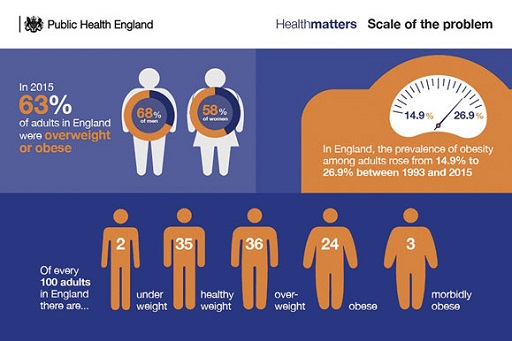
Quantitative research is particularly useful for studying whole populations and identifying general trends and relationships because it makes use of statistical data. The results of large-scale, quantitative studies are frequently summarised in documents like government-commissioned reports or academic journal articles, but these documents are not particularly accessible or easy to interpret. For this reason, departments such as Public Health England, sum up key findings using infographics, such as the ‘Scale of the problem’ image in the figure below.
The infographic presents the results for adults in various weight categories in England, and highlights that most adults in England are now either overweight or obese. Determining whether someone fits into a given category in terms of their weight for an infographic like that in Figure 3 requires the use of a particular quantitative metric, such as the Body Mass Index (BMI).
BMI is a widely used measure to work out if a person’s weight is seen as healthy. A BMI is calculated by dividing an adult’s weight in kilograms by their height in metres and then dividing the answer by their height again. As such, BMI can be used to calculate and compare weights of groups of people relative to their heights. The weight categories for interpreting BMI for adults are shown in Table 1.
| Weight category | BMI |
| underweight | <18.5 kg/m2 |
| healthy weight range | 18.5–25 kg/m2 |
| overweight | 25–30 kg/m2 |
| obese | 30–40 kg/m2 |
| morbidly obese or severely obese | >40 kg/m2 |

