
About this free course

Download this course

Share this free course

Ageism and age discrimination

Start this free course now. Just create an account and sign in. Enrol on the course to track your learning.

A line graph titled ‘Median age of population – United Kingdom’. The x-axis shows years from 1955 to 2025 in 10-year intervals. The y-axis shows median age from 30.0 to 42.0. Data points: 1955 – 34.1, 1965 – 34.1, 1975 – 32.9, 1985 – 34.3, 1995 – 35.6, 2005 – 37.5, 2015 – 38.8, 2025 – 40.1. The trend shows a slight dip in 1975, then a steady increase to 40.1 by 2025. Source: United Nations, Revision of World Population Prospects (2024).
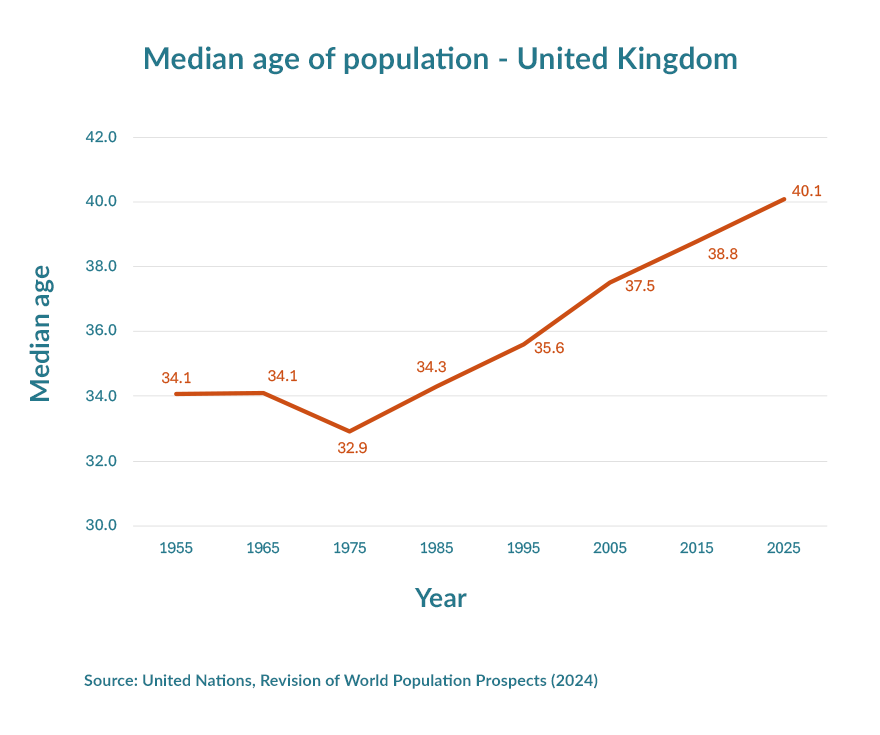
Figure 7: Median age since 1955 in the UK (UN, 2024)

 2 Age discrimination and UK law