

11.1 Inputs and outputs
As you saw in Activity 12, an organisation’s relationship to the natural environment can be quite extensive and often complex. There are many ways to structure your thinking about the links between an organisation and the environment, but one common way is to think of them falling into two main categories: inputs into the organisation and outputs from the organisation. This can be captured in the form of a basic input–output model. Input–output models have their origins in economics.
They can be quite complicated to develop, requiring significant quantitative calculations and measurements. The purpose here is not to model or engage in complex calculations, but to use the idea of inputs and outputs to reflect upon the relationships between an environment and an organisation, as shown in Figure 11.
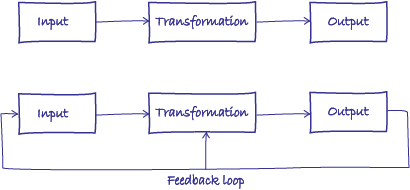
The upper part of the diagram shows a basic input–output model. The central box refers to the transformation by which inputs are converted to outputs. This is usually some kind of process and can be generalised as the organisation itself.
The input refers to something being put into the system (in this case the system is an organisation). This is transformed by the organisation (or parts of it) through an activity or function of the organisation. An output refers to whatever is produced by the system or parts of it.
A simple example would be a sheet of paper (input) used for writing on (transformation) by a member of an organisation to produce a report (output). The more complex an organisation, the more likely it is that the outputs of one part of the organisation will form the inputs to another part of the organisation, or perhaps another organisation.
In the lower part of the diagram, a feedback loop from the outputs to the transformation and inputs has been added. This is to show that:
- the organisation and its activities are linked by more than a linear dependency on inputs
- an organisation’s outputs are not ‘consequence free’ and will have impacts somewhere.
In other words, there is a ‘circular flow’ of interdependencies between an organisation’s outputs, inputs, activities, outputs and so on. It is this ‘flow’ or set of interdependent relationships in relation to the natural environment that is the focus of environmental management.
Having looked at the basic features of an input–output model, complete Activity 13.
Activity 13 Draw an input–output diagram
Drawing on your spray diagram from Activity 12, develop a basic input–output diagram based on Figure 11 to show the inputs and outputs of your selected organisation, which you think have some link to its (natural) environment. You don’t need to show inputs and outputs that occur within the organisation or the individual transformation processes within the organisation.
What does it reveal? Did it surprise you in any way? Did you find it easy to determine if something was an input or output?
Discussion
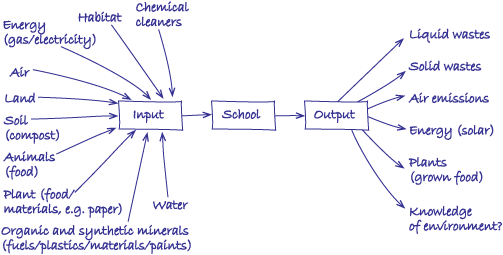
I have grouped and rearranged some inputs from my earlier spray diagram. Some items appear on both sides (e.g. energy, food) because of the solar panels on the roof of this particular school and food grown in the school by the pupils.
One item which might be a little unusual and specific to this type of organisation is ‘knowledge of environment’ as an output. I’m not sure an economist would be able to quantify this easily in a formal input–output model.
At one level it was relatively easy to decide on inputs/outputs with the more obvious elements like water, gas and electricity. But should I compile the list on an average day or over the whole life of the school? If the latter, would I have to include building materials on both sides of the model – as an input and then a waste item when the school is eventually demolished? I decided to focus on a day, but the activity did make me realise that input–output models are somewhat dependent on the time scale selected. Time frames seem to be just one more type of boundary choice.
Your diagram will depend on where your organisation is located, its purpose and your chosen time scale.
Inputs can be usefully sub-divided into two categories:
- Inputs needed to maintain the organisation infrastructure as an ongoing concern, such as building materials, water, heating, and power and computer equipment for office tasks.
- Inputs (some of which may be the same) required to achieve the purpose of the organisation – as a manufacturer or service provider, for example – such as metal ores to a steel manufacturer, crude oil to a refinery, or computers for teaching use in school classrooms.
Outputs from an organisation will vary enormously, but are likely to include waste materials, including atmospheric emissions, sewage and solid waste, and – in the case of many organisations – the end product itself (e.g. a manufactured item).
Even this very simple activity should convey some sense of the complexity of environmental management facing most organisations.
Making sense of the inputs and outputs of an organisation is often done with reference to environmental impacts. But ‘impacts’ often has a negative connotation – i.e. something hitting something with force, suddenly and often resulting in damage. While this has often been the case, it is also important to stress that impacts can also be positive. For example, a water company can clean up a polluted river system [Tip: hold Ctrl and click a link to open it in a new tab. (Hide tip)] , an oil company can provide funding for wildlife conservation and a car manufacturer’s endowment can fund research into social adaptation to climate change.
Let’s take a brief look at two examples that are often associated with (respectively) inputs and outputs of organisational activities – water and waste.