
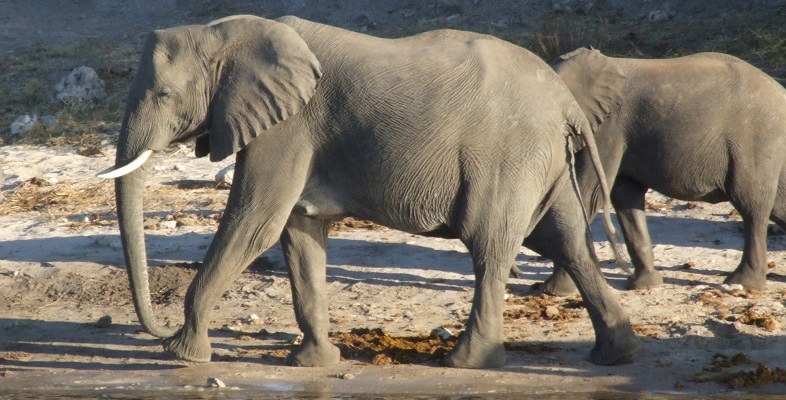
6.3.1 Comparing endothermic mammals with an ectotherm
Suppose an ectotherm – say a small lizard – is placed in a container in which the air temperature can be varied (a useful alternative term for the temperature ‘outside’ is ambient temperature, Ta). The temperature of the animal’s body (Tb) can be measured while Ta is changed. A miniature temperature-measuring probe inserted into the animal’s cloaca (the common opening for the gut and the urinogenital system) provides a continuous readout of body temperature. An experiment of this type is illustrated in the following video.
This test would start with a comfortable ambient temperature (comfortable for a lizard, that is), say about 38 °C, recording the animal’s body temperature, before lowering the ambient temperature to 30 °C and then measuring the body temperature once more, after allowing the animal to settle down over a couple of hours in the changed conditions.
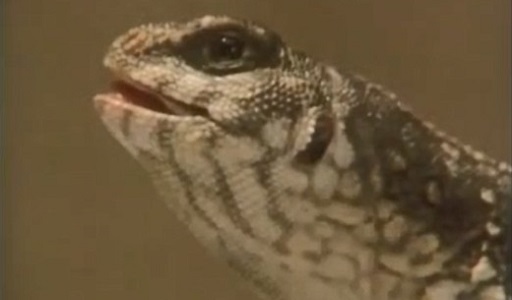
Transcript: Video 1 An experiment that shows that when presented with a choice of cold or warm environments, a lizard can shuttle between them to regulate Tb
Reading graphs
You’ll study two graphs in the rest of this section. Graphs are often used to display data in a way that makes trends easier to see than in a table. Simple graphs have two axes, one running horizontally, and the other vertically. They are labelled in the same way as the column headings of a table and the data points are then plotted.
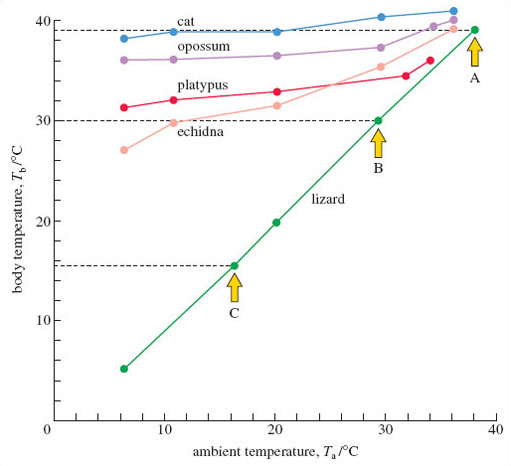
Figure 19 shows the type of results this experiment would produce. Concentrate for the moment on the data for the lizard. In this graph, the horizontal axis measures ambient temperature, and the vertical axis measures body temperature. For a particular Ta, say 38 °C, there’s a corresponding measure of the lizard’s Tb – in this instance, it was 39 °C, which you can check by following the horizontal dashed line across to the vertical axis, where the value is identified by arrow A. At a Ta of 30 °C, the lizard’s Tb was also 30 °C, as identified by arrow B. For a Ta of 16 °C, the value of Tb was 15.5 °C, as identified by arrow C. Plotting these points accurately is a lot easier to do if you use graph paper. When the full range of ‘lizard’ values is plotted, a line is drawn between them – the lowest plotted values of Ta and Tb are 6 °C and 5 °C respectively.
The same procedure can be repeated for a placental mammal, such as the cat. Look now at the cat data in Figure 19 and check that you follow the plotted points; for example, at a Ta of 10 °C, Tb is 39 °C. Joining all the plotted points gives a more flattened but somewhat ‘jagged’ line over the measured range of ambient temperatures.
Question 6
What’s the most striking difference between the way in which the cat and the lizard respond to changes of ambient temperature?
Answer
The body temperature of the cat stays much the same when the ambient temperature falls. But in the lizard, the body temperature falls as ambient temperature drops.
So, the endothermic cat is able to maintain its body temperature – at a high and constant temperature (of about 39 °C), whereas in these conditions, the lizard has seemingly little option but to allow its body temperature to conform to that of its environment. As is typical of mammals, the cat is regulating its body temperature – more technically, it is demonstrating thermoregulation. On this evidence, the lizard is a conformer – body and ambient temperature change in step. But an ability to thermoregulate is not unique to mammals; birds do so very proficiently and even some fish (such as the tuna mentioned earlier) and a few insects do so, in a rather elementary fashion. You’ll notice from Figure 19 that monotremes (and the marsupial representative – the opossum) are also able to thermoregulate, though less precisely than the cat.