

8.2 P-value
We can also find the p-value for t-test using Excel functions. For t-test, the Excel function is more complex than z-test. We have three different functions.
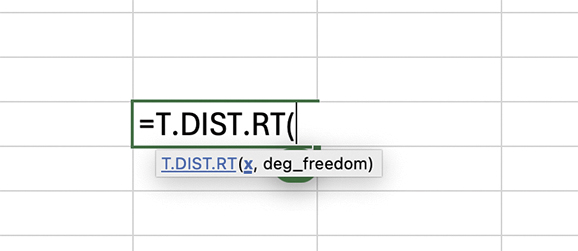
Upper Tailed (One-Tailed) t-Test:
Formula: =T.DIST.RT(x, deg_freedom)
Where:
- You input the calcuated t-statistic as “x”
- deg_freedom is the number of degree of freedom
This function is used when we are testing if a sample mean is significantly greater than a hypothesised value.
In our marketing campaign case, we found that our t-statistic = 2.643.
We can use this function to find p-value: =T.DIST.RT(2.643, 79)
This yields a p-value of approximately 0.005, indicating strong evidence that the campaign increased purchases.
After exploring how you can calculate p-values for upper-tailed t-tests, it is important to understand that Microsoft Excel also offers a specific function for determining p-values in lower-tailed t-tests. You will find this function particularly valuable when you need to assess whether a sample mean is significantly less than a hypothesised value. Excel’s built-in capabilities will streamline your process, allowing you to perform efficient and accurate statistical analysis without resorting to manual calculations.
You will encounter lower-tailed t-tests in various research scenarios where you focus on determining if a sample statistic is significantly lower than a population parameter. For example, in quality control, you might test whether the mean weight of a product is significantly less than the specified standard. In medical research, you could investigate whether a new treatment reduces symptoms significantly more than an existing treatment.
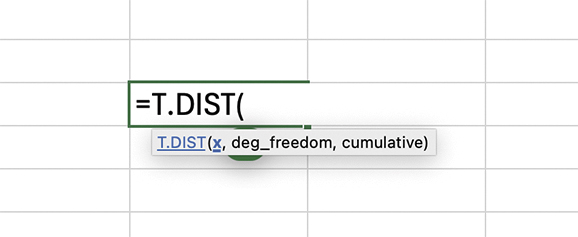
Lower-Tailed (One-Tailed) t-Test:
Formula: =T.DIST(x, deg_freedom, cumulative)
Where:
- You input the calcuated t-statistic as “x”
- deg_freedom is the number of degree of freedom
- cumulative is set to “TRUE”
This function is used when we are testing if a sample mean is significantly less than a hypothesised value.
A negative t-statistic is used because we are looking at the lower tail of the distribution.
Having explored both upper-tailed and lower-tailed t-tests, you should now turn your attention to two-tailed t-tests. Microsoft Excel continues to support your statistical analysis needs by offering a function that enables you to calculate p-values for two-tailed t-tests efficiently. This type of test broadens your analytical capabilities, as you will find it particularly useful when you need to determine whether a sample mean differs significantly from a hypothesised value in either direction, without specifying a particular tail of the distribution.
Two-Tailed t-Test:
Formula: =T.DIST.2T(x, deg_freedom)
Where:
- You input the absolute value of calcuated t-statistic as “x”
- deg_freedom is the number degree of freedom
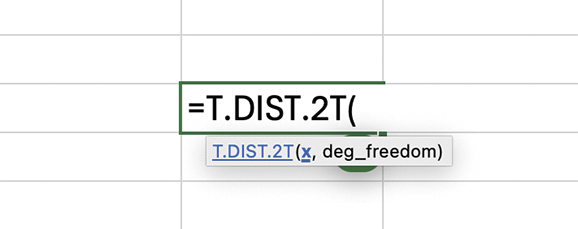
This function is used when we are testing if a sample mean is significantly different (either higher or lower) from a hypothesised value. We use the absolute value of the t-statistic because we are considering both tails of the distribution.
Activity 7: One sample t-test
A marketing manager wants to assess whether a recent promotional campaign has increased the average sales per customer. Before the campaign, the average sales per customer were believed to be 35 units. The manager wants to test this claim rigorously at a 95% confidence level based on the sample data of 51 customers. Download the Excel file to review the data. Excel file: Sales dataset
Tip: The Excel function "Descriptive Statistics" provides all the information you need to calculate the t-statistic.
You can access via Data > Data Analysis > Descriptive Statistics.
- Type B2:B52 in the Input Range box
- Tick "Summary Statistics"
- Click OK
What you will get Excel will show you important numbers including:
- Samplle mean (x̄)
- Sample standard deviation (s)
- Count (sample size - n)
Answer
Step 1: Formulate Hypotheses
- H₀: The average sales per customer is less than or equal to 35 units (H₀: μ ≤ 35).
- H₁: The average sales per customer has increased (H₁: μ > 35).
Step 2: Obtain all the information needed to calculate t-statistics
- Sample size (n) = 51
- Sample mean (x̄) = 38.235
- Sample standard deviation (s) = 11.728
Step 3: Calculate the T-Statistic
Step 4: Determine t-crtical value
There are 51 customers in the sample. So the degree of freedom = 51 -1 = 50
For an upper tailed test with α = 0.05 and 50 degrees of freedom, we input:
- =T.INV(0.95,50)
The formula will return the t critical value, which in this case would be approximately 1.676.
Step 5: Make the Decision
- t-Statistic: 1.970
- t-Critical Value: 1.676
Since the calculated t-statistic (1.970) is greater than the critical t-value (1.676), we reject the null hypothesis (H₀).
Moreover, you calculate the p-value as well.
Since this is a one-tailed (upper-tailed) test, use the T.DIST.RT function in Excel to calculate the p-value.
- =T.DIST.RT(1.970, 50)
Excel will return the p-value approximately 0.0277
This p-value is less than the significance level of 0.05, confirming the rejection of the null hypothesis.