

2.3.1 Try some yourself
Activity 10
This table categorises Tom's activities for the day.
| Activity | Time/hours |
|---|---|
| Sleeping | 8 |
| Working | 7 |
| Eating | 3 |
| Travelling | 2 |
| Watching TV | 3 |
| Other | 1 |
| Total | 24 |
Shade in the pie chart below to illustrate how Tom's day is broken up. Click on a colour in the list on the right, then click the segment you want to shade.
Activity 11
The pie chart below shows the proportions of people living in different kinds of accommodation in a particular town. Interpret what the pie chart indicates by estimating the percentage of people in each category.
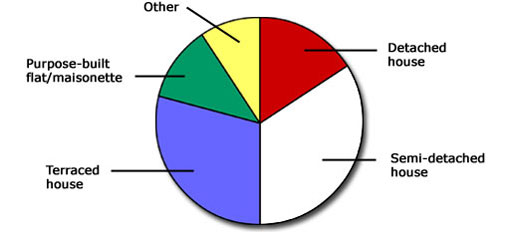
Answer
The largest proportion of people (about 33%) live in semi-detached houses. About 30% live in terraced houses, and about 17% live in detached houses. About 10% live in flats or maisonettes, and about 10% live in some other type of accommodation.
Activity 12
These pie charts represent the proportions of the world's land area and population for various regions at the end of the twentieth century.

Make rough estimates of the fraction of the land area and the fraction of the population that are in each of the following regions:
(a) North America
(b) Asia and Oceania
(c) Europe
(d) Africa.
Answer
(a) North America has approximately a sixth of the land area and about a twentieth of the population.
(b) Asia and Oceania take up a little more than one third of the land area and have almost two thirds of the population.
(c) Europe has approximately a twelfth of the land area and an eighth of the population.
(d) Africa has a quarter of the land area and just over an eighth of the population.
(Note: Your answers may differ slightly as these are only rough estimates.)