
2.4 Bar charts and frequency diagrams
Pie charts are useful for showing proportions, but different types of chart have to be used for representing other kinds of data. A number of these charts are described in this section. The most well known is the bar chart.
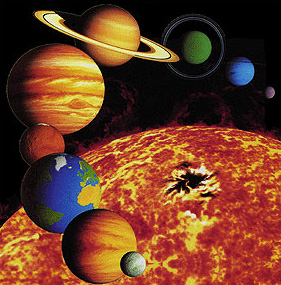
A bar chart can be seen below. The length of each bar represents the diameter of the planet. Among other things, the chart shows that the diameter of the Earth is about 13 000 km.
The bars on a bar chart are usually drawn not touching one another. Furthermore, to prevent a bar chart giving a misleading representation of the data, the bars should be the same width, and the scale (in this case, the diameter of the planet) should start from zero and be clearly labelled.

In the bar chart above, a numerical value is associated with each planet. In a similar way, a bar chart could be drawn representing, for example, the distances travelled in one hour by different modes of transport: on foot, by bicycle, etc. Again, a numerical value (distance travelled) would be associated with each category (foot, bicycle, etc.). For data of this kind, bar charts are usually the most suitable form of representation.
Another kind of data relates to how many items there are in a particular category. Such information is often presented in tables that are known as frequency tables – the frequencies are the number of times that each possibility occurred.
In some cases, the information given in a frequency table can be represented by a bar chart, but in other cases the nature of the data means that another kind of chart (as described later in this section) is required. For convenience, diagrams produced from frequency tables, whether bar charts or some other kind of chart, are all called frequency diagrams. Bar charts can be drawn with either horizontal or vertical bars but frequency diagrams often have vertical bars.
Example 7
This frequency table shows the number of children per household in a sample of 30 households. Draw a frequency diagram in the form of a bar chart to illustrate the information.
| Number | Number |
|---|---|
| of children | of households |
| 1 | 4 |
| 2 | 7 |
| 3 | 11 |
| 4 | 4 |
| 5 | 3 |
| 6 | 0 |
| 7 | 1 |
| Total | 30 |
Answer
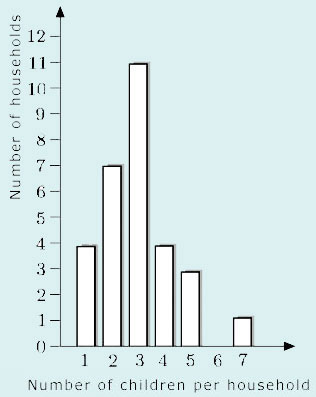
The number of children per household has been represented along the horizontal axis, and the number of households up the vertical axis. The height of each bar represents the number of households containing that number of children.
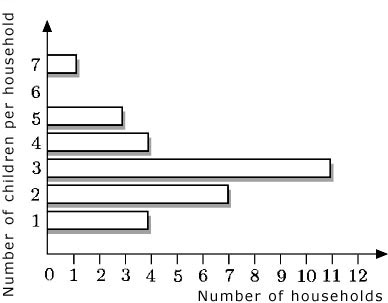
The bars in a bar chart can be drawn either horizontally or vertically. For example, the bar chart in Example 7 could have been drawn as follows:
It is important to appreciate that frequency diagrams in the form of bar charts are used only when data are collected in separate categories. Such data, called discrete data, are gathered by counting things. They include data that can only take certain values and cannot have intermediate values (for example, family size, which can only take whole numbers, or shoe size, which can only take whole and half numbers).
A different kind of frequency diagram is used to represent continuous data – data that are measured rather than counted (for instance, people's heights and weights, times taken for journeys or phone-calls). The distinction between discrete and continuous data shows up visually in frequency diagrams according to whether or not there are gaps between adjacent bars: thus, a frequency diagram for discrete data (that is, a bar chart) should have these gaps (to emphasise that the data are in separate categories), but a frequency diagram for continuous data should be drawn with a continuous scale and with adjacent bars touching (to emphasise the continuous nature of the data). Note that not all charts published adhere to this rule. You will meet the term ‘histogram’ for some kinds of frequency diagram used to represent continuous data.
Below is an example of a frequency diagram for continuous data. It represents the birthweights of 23 babies, as given in the table.
| Birthweight/grams | Number of babies |
|---|---|
| Above 1750 up to and including 2250 | 1 |
| Above 2250 up to and including 2750 | 0 |
| Above 2750 up to and including 3250 | 5 |
| Above 3250 up to and including 3750 | 12 |
| Above 3750 up to and including 4250 | 4 |
| Above 4250 up to and including 4750 | 1 |
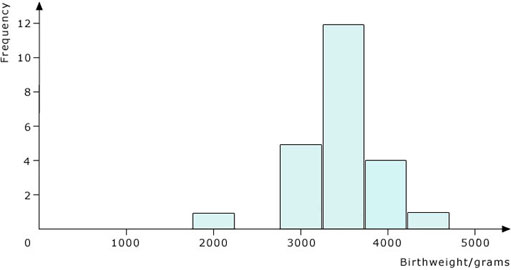
Notice that frequency diagrams for continuous data always have the frequencies shown vertically, while the horizontal scale is continuous. Also notice how the bars are drawn: the lines showing the divisions between each bar are at the boundaries between the groups of data (that is, at 2250 g, 2750 g, 3250 g, etc.). The height of each column shows the number of babies whose weights are in each group.
Sometimes you may want to compare the data given in two or more frequency diagrams. The two frequency diagrams for continuous data that are set out below show the waiting time until the first clinical assessment at the A&E departments of two hospitals, A and B. The waiting times of 300 people were surveyed for each hospital.
Click on ‘Hospital A’ or ‘Hospital B’ to see the respective frequency diagrams.
These frequency diagrams show that for Hospital A, the most often reported time waiting was between 30 and 35 minutes, while for Hospital B it was between 10 and 15 minutes.