4 Hierarchical data
Many data sets contain within them – either explicitly or implicitly – a set of structural relations between different parts of the data set.
One common way of structuring data is in the form of a hierarchy, or ‘family tree’. Typical examples are organisational charts and library classification schemes.
There is some optional material on creating organisational data in Microsoft Word and Google Spreadsheets in section 9.2.
Hierarchical diagrams are also widely used as the basis of mind-mapping tools, where ‘child’ ideas are developed leading off from a central core topic. A mind-mapping tool can provide a very good way of helping you ‘unpack’ or explore an idea.
There is some optional material in mind-mapping tools in section 9.3.
One of the problems with displaying hierarchies is that they can get very large – and hard to display – very quickly.
There are several ways around this problem. For example, an interactive visualisation can ‘collapse’ each branch of the tree, hiding the sub-branches until you want to see them. In this sense, hierarchical organisations can also be thought of as containing sets of ‘boxes within boxes’.
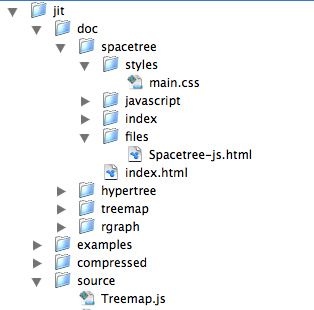
You may already be familiar with this sort of approach from your computer – many file managers offer a hierarchical visualisation of file organisation through ‘nested’ folders which you can open up or collapse as you wish. Figure 11 shows an example of this.