Skip to content
Skip to main content

About this free course

Download this course

Share this free course

Visualisation: visual representations of data and information

Start this free course now. Just create an account and sign in. Enrol and complete the course for a free statement of participation or digital badge if available.

5.4 Proportional symbol maps

Proportional symbol maps, or more often proportional circle maps, associate a particular symbol, typically a circle, with a particular point on a map, such as the centre of a city, or the capital city of a country. The diameter of the circle represents some function of the quantity being visualised.

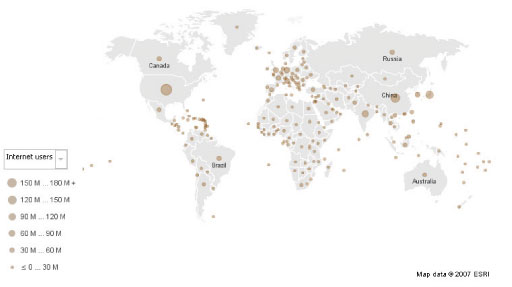
For example, the proportional symbol map in Figure 15 depicts the number of internet users per country in 2007 (data source CIA World Factbook; map produced using Many Eyes).

World symbol map showing internet users
Figure 15 Proportional symbol map of the number of internet users per country (2007)