

12 Is some demand unnecessary?
Think about the last time you phoned a service provider. Was this for a good reason (e.g. you wanted to buy something) or was it because something had gone wrong? When we analyse calls going into service calls centres we often find that a very large proportion of the calls up to 80% are from unhappy or disgruntled customers reporting a problem rather than customers contacting the service to generate new business. Demand entering the system for avoidable reasons is often referred to as failure demand. One definition is shown below.
‘Failure demand is demand caused by a failure to do something or do something right for the customer.’
This idea that much demand is unnecessary or avoidable came from John Seddon when he had looked at calls coming into call centres. He divides demand into two categories ‘true demand’, i.e. new demand from a customer and ‘failure demand’.
Activity 10 Failure demand
John Seddon and his consultancy team analysed 1200 calls coming into a council housing service call centre (Evaluating Systems Thinking in Housing, 2008). Most callers were council tenants who were dealing with necessary repairs to their properties. The team grouped these calls around main themes, listed below. Use the table to click whether you see the demand as ‘true’ demand or ‘failure demand’. Count up what percentage of the total you see as failure demand.
Then look at the two columns. What underlying problems are revealed by the nature and levels of failure demand?
Discussion
Those calls requesting a service for the first time, such as ‘I need a plumber’, are all true demand. The failure demand calls are made when something has either gone wrong, e.g. ‘the repair was not fixed properly’, or the work is being chased by the customer, e.g. ‘I’m still waiting for…’.
The chart below shows that 80% of the calls coming into the system were failure demand and the most common types of call were all failure demand.
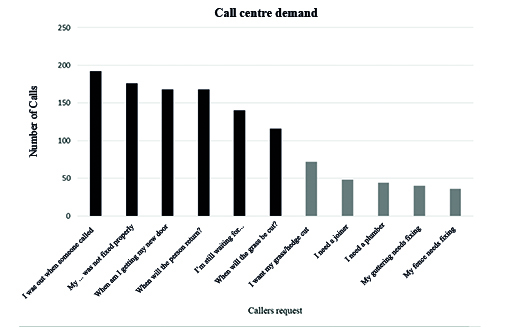
There is clearly a problem within the housing service because too many work crews are attending properties when the customer is not present. They also seem to have difficulty finishing a job in one visit (shortage of spare parts?), or returning to finish a job in a timely manner (scheduling?). When the problem was studied in more depth it became clear that work crews were not empowered to deal flexibly with their customers’ problems because the cost control systems limited the availability of spares, required too many sign-offs before work was completed, and was too rigid in its scheduling of crews. Once crews were given more control over their work they were able to call customers in advance and ask about the need for spare parts etc., with deliveries to site quickly. This produced a huge improvement in the quality of the service to the customer and reduced demand.
This next exercise allows us to explore the notion of failure demand in a practical exercise. Use this as an opportunity to see whether or not you can spot unnecessary demand in a system.
Activity 11 Failure demand
Have a think about how much of the work coming in to your system might be classed as failure demand. What are the underlying causes of that demand? Also think about the impact on your work and whether or not the demand can be removed.
Discussion
One of the biggest, somewhat hidden, sources of failure demand can be seen just by looking in your email inbox. Have a look to see how many emails are repeat requests, such as reminders for deadlines. How many of the emails are you copied in when it’s irrelevant to you?
For much of the demand coming in, have a look to see if there are more opportunities to do the work in the first contact, rather than prioritising or postponing work. One police force found that 100 non-urgent calls into the contact centre generated about 60 unnecessary additional contacts, with some calls needing 5 or more attempts to do simple things like answer a question.
This session concludes all the topics of Capacity and demand management. Now read the course conclusion on the next page.