3 Unfolding
3.1 Unfolding in Mozart
We are now going to look at cases where Mozart creates a single melodic line which contains more than one part, as in the last example in Section 2, but where these voices work in counterpoint, more in the fashion of the examples from Vivaldi and Bach. This section is presented in conjunction with several video clips. To follow these, you will need a pencil and some manuscript paper. Some of the examples are reproduced here as an aid to following the process of analysis, and the videos will ask you to return to the course text at certain points.
Activity 5
When you are ready, play the video clip below and follow the activities described there.
Transcript: Unfolding in Mozart
Activity 6
You are going to start to make an analytical graph of the bars that we've been looking at on the video, using the symbols that you are already familiar with. For this activity you will need Examples 9 and 10 below.
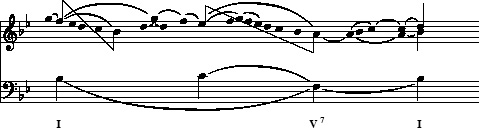
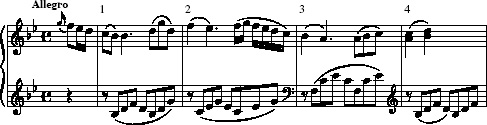
Example 9 shows you the bars of Mozart's score. Example 10 is a version of these four bars which gives all the notes just as noteheads, with the bar numbers indicated above. A few changes have been made in the alignment to show where the melody harmonises with the bass. Three slurs have already been put in to show where the appoggiaturas are. You should follow the instructions below to continue drawing the graph. There are five things to do. A pdf of Example 10 is provided below for you to print out for marking up.
Click to download pdf version of Example 10 bar graph [Tip: hold Ctrl and click a link to open it in a new tab. (Hide tip)] .
-
Put stems going upwards on the main notes of the top voice.
-
Put stems going downwards on the notes which make the ‘structural alto’ voice.
-
Put stems, also going downwards, on the main harmony notes of the bass voice.
-
Put a slur to show where there is a passing note in the melody line.
-
Finally, put a slur to show how each remaining notehead belongs to one of the notes with a stem.
Activity 7
Transcript: Making an analytical graph
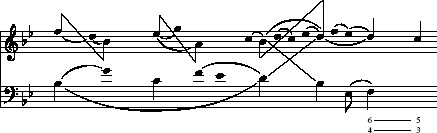
To help you compare your graph with mine, my solution is reprinted here as Example 11. You will also see three new notational symbols added. The final completed graph is printed below as Example 12.
Activity 8
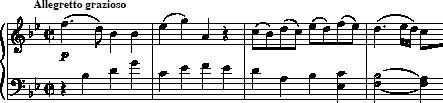
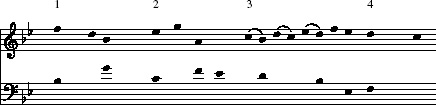
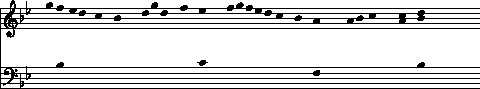
As in the previous activity, you're going to start to make an analytical graph, this time of the first four bars of the first movement of K333. As before, you will find below a version of the score (Example 13) and a version of these four bars which gives all the notes just as noteheads (Example 14). A few changes have been made in the alignment to show where the melody harmonises with the bass. As before, you should add stems and slurs to these noteheads. This time, I don't want you to make such a detailed analysis.
Click to download pdf version of Example 14 bar graph
Follow the five instructions below.
-
Identify unfolded intervals in the melody line.
-
Place upward stems on the notes of the ‘structural treble’.
-
Place downward stems on the notes of the ‘structural alto’.
-
Connect the stems with diagonal beams to show the unfoldings.
-
Add slurs to show how the noteheads between the notes with stems are related to them.
Discussion
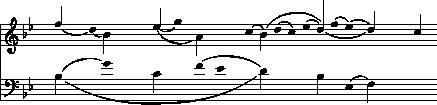
Now check your graph against Example 15.
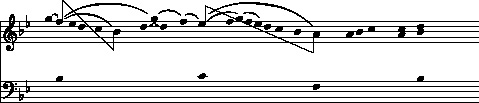
When you have done this, turn to the next video clip, and watch how the graph is completed. My final version is printed below as Example 16.
Transcript: Completing the graph