2 River flow
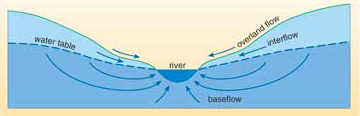
The total land area drained by a river system, including all its tributaries, is called a river catchment. The water in a river comes not only from direct precipitation, springs and overland flow (i.e. water flowing across the ground surface, excluding that in streams and rivers; this is rare in temperate vegetated areas) but also from the underground flow of water, directly to the river. Part of this underground flow is interflow, that part of infiltration which moves through the unsaturated zone without penetrating to the main water table (Figure 3). It occurs because the permeability of the unsaturated zone tends to reduce with depth thereby restricting infiltration. The term also includes water that flows from any perched water tables in the unsaturated.
Below the water table, groundwater can discharge directly into a river, and this is called baseflow (Figure 3). The contribution of baseflow to river flow varies greatly with the geology and topography of the catchment and with the season. The baseflow contribution is low for a river in a catchment of impermeable rocks, where rainfall infiltrates slowly, and the overland flow is consequently high. In contrast, for rivers with a catchment of permeable rocks there may be no water from overland flow in the rivers.All of the river flow in this case will be baseflow. In Britain, baseflow usually forms a higher proportion of the total flow in summer than in winter, because evaporation is higher in summer and overland flow is therefore lower, whereas groundwater is released to rivers as baseflow more consistently throughout the year.
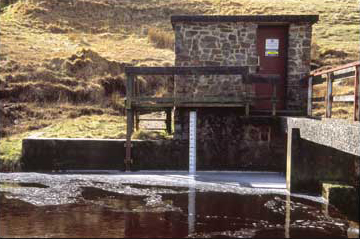
The water level in a river, called the stage, is easy to measure (Figure 4), whereas the discharge of a river, the volume of water that flows past a point in a certain time, cannot be measured directly. However, the measurement, or gauging, of river discharge is necessary for the calculation of surface water resources. Regularly recorded discharge values also give information about the maximum and minimum volumes of water flowing in the river, which is required for planning water supply schemes and for flood-control and hydroelectric projects. The discharge (Q) of a river is related to the speed of flow (v) by the equation:

where A is the cross-sectional area of the river.
The cross-sectional area of a river channel at a discharge measurement point is determined from measurements of the depth of the water taken at known intervals across the river. The speed of the flow can be measured using current meters; these have vanes that are turned by the water flowing past, the rate of rotation giving the water speed. However, the speed is not constant from bank to bank or from the bed to the surface, so a number of speed measurements must be made at different depths at intervals across the river. In order to do this the river cross-section is divided into small areas, and the discharge within each area is calculated from the measured speeds (area × speed across that section). The total discharge is the sum of the individual discharges.
This method is very laborious, as many speed-depth measurements have to be made for each determination of discharge. However, once the discharge at a particular stage (water level) has been measured, the assumption can be made that for the same stage at that location, the discharge will be the same. This means that if the discharge in the river has been measured at different stages, so that the relationship between stage and discharge is known at that location, the river discharge can be estimated from measurement of stage alone; this is read directly from a post in the river. Figure 5 shows a rating curve for a river; it is a plot of discharge values measured at various stages, with a smooth curve drawn through the plotted points. The shapes of rating curves can vary considerably: they may be quite different from the curve in Figure 5.
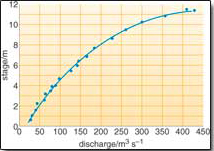
How accurately do you think the discharge can be estimated from the stage, using a rating curve?
Reasonably accurately, as most points lie fairly close to the curve. The differences arise from the errors in measuring the river cross-section and flow rates.Where possible, concrete weirs are built into the river at gauging stations to reduce the errors involved in using rating curves to estimate discharge (Figure 6). These have a straightforward cross-section, with either a horizontal surface, or a V-notch.
A record of the discharge over time is called a discharge hydrograph (usually abbreviated to hydrograph). This is calculated from a stage hydrograph, a record of stage over time.
River discharge is related to the effective precipitation over the catchment. After precipitation begins, the discharge usually increases rapidly to a peak and then decreases more slowly (Figure 7). Initially the increased discharge comes from overland flow, then interflow, but these die away fairly soon after the rain stops falling, eventually leaving only the baseflow contribution to the river.
Hydrographs can be used to show short-term variations (recorded over a few days), such as how discharge from a catchment responds to individual rainstorms (Figure 7), or long-term variations (recorded over a year or more), illustrating a climatic regime. The resultant hydrographs are called short-period and long-period hydrographs, respectively. The shape of a hydrograph depends on several factors:
Short-term variations: the size and shape of the catchment area. Generally, the larger the catchment, the higher the peak discharge for a given rainfall and the longer the time difference (lag) between rainfall maximum and river discharge maximum. The steepness of the slope of the ground is also significant, as gentle slopes produce a longer time difference because the water runs off more slowly.
Short-term variations: vegetation and land use. Vegetation cover and human use of the land affects hydrographs, as described in Box 1.
Short- to medium-term variations: the geology of the catchment, particularly the permeability of the rocks. An impermeable catchment will produce higher peak discharges but lower flows at other times and respond more quickly than a permeable catchment. In a permeable catchment, with a greater baseflow contribution, there is less variation in discharge.
Long-term variations: climatic factors, such as seasonal rainfall and melting snow.
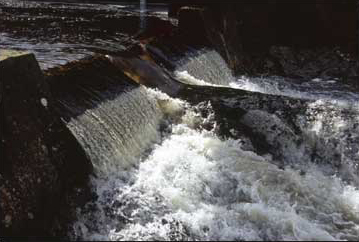
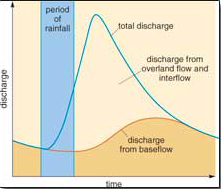
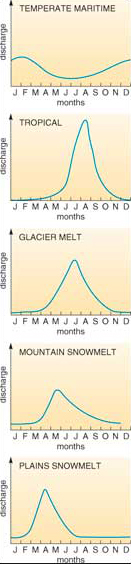
Figure 8 shows the types of long-period hydrograph to be expected from different climatic regimes. (These hydrographs cover a year, whereas the hydrograph in Figure 7 is for a few days only.) In temperate maritime climates, rainfall occurs all the year, but as temperature is higher in summer, evaporation is also greater in summer, so there is a greater discharge in winter than in summer.Within the tropics and in the equatorial zone there are usually wet and dry seasons, or even two wet seasons , and hydrographs are controlled by the effective rainfall pattern.
The other hydrographs in Figure 8 (glacier melt, mountain snowmelt and plains snowmelt) are dependent on seasonal temperature, in particular when it becomes warm enough to melt snow and ice. In the Northern Hemisphere, as melting takes place mainly in the summer, the peak discharges are in June or July. Melting of mountain snow starts earlier in the year, giving a peak discharge in May or June. Snowmelt from plains (the interior regions of large continents) depends on latitude, with the more southerly rivers having peak discharges in April, and more northerly rivers having a peak in June. River hydrographs are often a combination of one or more of the climatic regimes in Figure 8.
Box 1 Land use and river discharge
Changes made in the use of the land surface have varying effects on the overland flow and infiltration characteristics of a catchment, and so can change the river discharge pattern.
Plants, especially trees, intercept precipitation and prevent it reaching the ground. An area that is forested also usually has a thick layer of decaying vegetation on the ground, which absorbs water, so plants, and forests in particular, reduce overland flow to rivers (Figure 9a). The peak discharge is less in a forested area and the lag time is greater. Catchments of many upland reservoirs are forested, but as Figure 9a demonstrates, this may not be ideal for water supply, as afforestation reduces the total volume of water reaching a river, although it makes the flow more uniform.
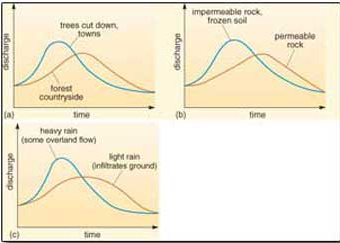
Urbanization of land usually results in less infiltration and faster overland flow from buildings and roads, giving very high peak discharges on hydrographs (Figure 9a) and sometimes the risk of flooding. To reduce this risk, and maintain the water table, balancing lakes are constructed in newly urbanized areas (such as Milton Keynes) to provide an area for increased infiltration.
If the ground is relatively impermeable, which can occur when the soil is frozen or the underlying rock is impermeable, lag time is reduced and peak discharge is increased (Figure 9b). The same effect occurs with heavy rainfall; with light rain there is time to infiltrate the ground, but heavier rainfall causes mostly overland flow (Figure 9c).
Draining wetlands or marshes removes water from such areas more quickly, increasing the peak flow and runoff volume. The rapid discharge of water reduces the time available for infiltration and may lower the water table, modifying the vegetation and changing the discharge characteristics of the area.
Question 1
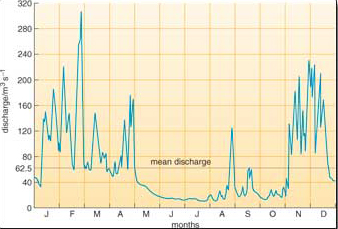
Figure 10 is a hydrograph, covering a period of a year.
a.Which climatic regime or regimes would produce a hydrograph of this shape?
b.What is the maximum discharge and how many times greater than the mean discharge is it?
c.What might be the cause of the high discharge peaks?
Answer
a.The general shape of the hydrograph indicates a temperatemaritime regime, with some contribution from melting snow in April. (The river is a British one, the Severn at Bewdley.)
b.The maximum discharge is about 310 m3 s−1. This is almost five times greater than the mean of 62.5 m3 s−1.
c.The high rates of discharge are caused by periods of heavy rain due to the passage of weather fronts.
The river represented in Figure 10 discharges more water in the winter, whereas demand for water is higher in the hotter summer. To satisfy the summer demand, water must be stored during the winter and spring.
Question 2
Estimate the percentage contributed by the baseflow to the discharge of the River Severn at Bewdley (Figure 10), for (a) the months November-April and (b) the months May-October. Give your answers to the nearest 10%. You may need to refer to Figure 7 to identify the baseflow component of the hydrograph.
Answer
The baseflow contribution on the hydrograph is the consistent flow that is independent of the rainstorm peaks. Both mean baseflow and discharge over a period of months can only be estimated approximately.
a.Mean baseflow is about 80m3 s−1 over the November to April period, and mean discharge during this period is about 120m3 s−1, so baseflow is about 60% of discharge for the winter months.
b.Mean baseflow is about 15m3 s−1 over the May to October period, and mean discharge during this period is about 20m3 s−1, so baseflow is about 75% of discharge for the summer months (when there is little evidence of overland flow, so the proportion contributed by the baseflow is relatively higher).