

3.3 Principle 3: Shapes and Coordinates
In this principle, you will learn how to draw some shapes and how to position them on the canvas using the coordinate system in p5.js. In all these examples, you will be using a square canvas size of 300 × 300 pixels, so all our shapes always need to fit into that space.
X and y-coordinates in p5.js
p5.js uses an x- and y-coordinate system to identify locations on the canvas and to position shapes.
The x/y-coordinate system
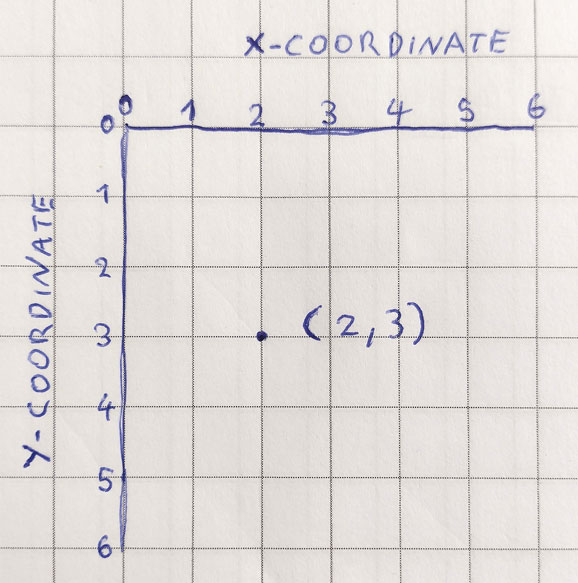
The origin point for the coordinates starts in the top left-hand corner of the canvas with 0,0.
The x-coordinate is the horizontal distance in pixels from the left edge, while the y-coordinate is the vertical distance from the top edge.
The x-axis is left to right. The y-axis is top to bottom.
In Figure 7, I have used some graph paper to draw a dot at the position x2 and y3 which is written as point(2, 3) in p5.js code. The x-coordinate always comes first, followed by a comma and then the y-coordinate.
If you forget the comma, you will get an error in your program. Note that the coordinate system starts in the top left-hand corner.
Point
Drawing a point is easy in p5.js. It has two parameters for the x- and y-coordinates, point(x, y):
x: the number that specifies the x-coordinate
y: the number that specifies the y-coordinate.
Square
The square shape has three parameters, square(x, y, s):
x: the number that specifies the x-coordinate of the top left corner of the square
y: the number that specifies the y-coordinate of the top left corner of the square
s: the number that specifies the width and height of the square.
Change the outline
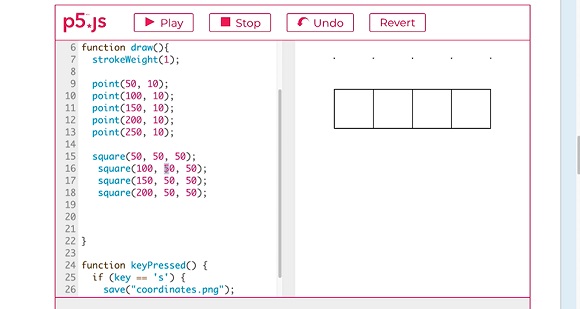
Notice that the outline of the square in Program 3 is very thin. The way to control this is by using the strokeWeight() command – you can put any number you like inside the brackets. I recommend a number between 1 and 10.
(p5.js reference: strokeWeight)
Note that it matters where in the code you put the commands. The program runs the code sequentially, line by line from top to bottom. If you add strokeWeight(), then all the subsequent shapes will have that property applied. This property persists for all shapes on the next loop. If you want the shapes to have a different outline, then you need to add another strokeWeight() command so that any subsequent shapes receive that property.
Watch Video 5, which shows you how to use the coordinate system.
Transcript: Video 5 Drawing squares using the coordinate system
Activity 3 Draw your own squares and tweak the outline
Use Program 3 Draw squares to draw multiple squares at different locations. You need to copy and paste the square command to create some additional squares and change the x- and y-coordinates. Remember that the origin point is in the top left-hand corner.
Change the strokeWeight() to give the points and squares a thick outline.
Keep playing with this activity until you understand the x- and y-coordinate system. This concept is important to understand for section 4 ‘Making Tiles’, where you will be creating tiles and wallpaper.