4.2 Hot-spot trails and true plate motions
In addition to volcanism associated with constructive and destructive plate boundaries there is a third important component to global volcanism. This occurs in the interior of plates and is associated with broad surface up-doming, which is often 1000 km across and hundreds of metres in elevation. Gravity anomalies across these domes show that they are not in isostatic equilibrium, but are supported from sub-lithospheric depths, presumably by upwelling mantle. Perhaps the best-known example is located beneath the active volcanoes of Hawaii (Section 3.4), whose long history of volcanism has been related to a structure in the deep mantle known as a mantle plume. Mantle plumes are an important feature of mantle convection, but for now it is sufficient to know that they produce surface volcanism that is not necessarily associated with plate boundaries. There are numerous plumes of different sizes recognised around the globe. Some are associated with chains of islands and seamounts, whereas others have produced long ridges in the ocean floor. A good example is the Ninetyeast Ridge in the Indian Ocean. Termed aseismic ridges because of a lack of seismicity along their lengths, these ridges are very different structures from the ocean ridges associated with constructive plate boundaries.
Box 4 Hawaii
Hawaii is part of an extensive chain of islands and submarine volcanic peaks (called seamounts) stretching almost 6000 km across the floor of the Pacific Ocean. The chain forms an 'L'-shaped chain of volcanic islands and seamounts across the sea floor that increase in age northwards from Hawaii (Figure 23).

Hawaii rises from the sea floor some 6 km below the Pacific Ocean to a summit elevation of about 4 km above sea level, making it taller than Mt Everest. Although all of the Hawaiian Islands are volcanic in origin, only Hawaii is currently active and still growing in size. The islands are situated within the Pacific Plate some 4000 km from the nearest plate boundary. The magma that has caused the volcanism is the result of a plume of anomalously hot material rising through the mantle. Where this plume impinges upon the base of the lithosphere, magma finds its way to the surface to produce a so-called hot spot. Other island and seamount chains located on the Pacific Plate (Figure 23) show a similar pattern of age progression, and are related to different hot spots. In fact, hot-spot volcanoes may be found dotted around the world and most of them are remote from plate boundaries.
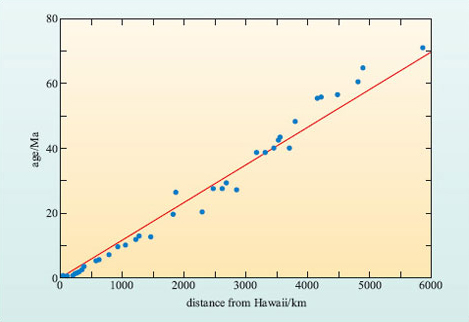
The ages of the islands and seamounts are proportional to their distance away from the currently active site of Hawaii, as shown in the graph in Figure 24. The best-fit line through the data points indicates that the site of volcanic activity has apparently migrated at a constant speed along the chain. Each island or seamount has been constructed as the Pacific Plate has moved over the stationary hot spot. If it is assumed that the Hawaiian hot spot has remained stationary with respect to the Earth's axis, then the rate of migration of volcanism along the chain gives the rate of plate movement across the Hawaiian hot spot.
Question 19
The Hawaii-Emperor chain of islands and seamounts is not straight, but kinked. What do you think the kink represents?
Answer
If the hot spot is stationary then this must represent a change in direction of the Pacific Plate.
Careful interpretation of the age progression along the Hawaii-Emperor chain suggests that this change in direction occurred 43-50 Ma ago, which ties in with a series of tectonic adjustments around the world, including the start of continental collision between India and Asia.
Activity 7
Use Figure 24 to estimate the average rate at which volcanic activity has appeared to move along the Hawaiian-Emperor Seamount Chain. Express your answer in mm y−1 to two significant figures. With reference to Figure 23, determine in which direction the active volcanism has moved, and from this, the direction the plate has moved. Note: the speed at which volcanic activity moves is the inverse of the gradient of the best-fit straight line.
Answer
You should recall that:
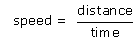
but the graph is plotted as time against distance, so the gradient of the graph as it is plotted is ![]() . To calculate the gradient, and hence the speed, choose distance two points on the best-fit straight line that are some distance apart and find their coordinates. For example, at a distance of 5500 km the age is 63 Ma, and at a distance of 1000 km the age is 11 Ma. The gradient of the line is:
. To calculate the gradient, and hence the speed, choose distance two points on the best-fit straight line that are some distance apart and find their coordinates. For example, at a distance of 5500 km the age is 63 Ma, and at a distance of 1000 km the age is 11 Ma. The gradient of the line is:
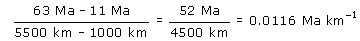
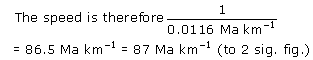
This is equivalent to 87 mm y−1. The current overall direction of migration of volcanism is towards the southeast, therefore the plate is moving to the northwest. However, prior to about 43-15 Ma volcanism migrated more or less due south, therefore the Pacific Plate prior to 43-15 Ma was moving to the north.
By assuming mantle plumes and hot spots are stationary, the motions derived from age progressions such as those along the Hawaii-Emperor Seamount Chain represent true plate motions. However, if the mantle plumes underlying hot spots have also moved with respect to the Earth's axis, but at a rate different from that of plate movement, then the motions defined by a hot-spot trace (see Figure 23) may be misleading.
Question 20
How do you think plate motions could be verified?
Answer
By measuring true plate motion from another hot-spot trace.
For the Pacific Plate, the Hawaiian hot spot may be the largest hot spot, but it is not the only example of a hot-spot trace on the ocean floor. Two other examples related to the mantle plumes currently beneath the Cobb and the Macdonald Seamounts are shown in Figure 23. You should be able to appreciate from this figure that both of these chains of seamounts and islands are broadly parallel with the Hawaiian-Emperor Seamount Chain, and the Austral-Marshall Islands Seamount Chain shows a similar bend. Detailed geochronology of these chains reveals that the age progression along them is also consistent with the rates of northwesterly plate motion derived from the Hawaiian-Emperor Seamount Chain. Since the chances of three (and more) hot-spot traces moving independently of the plates and one another giving such similar results is remote, these results strongly indicate that hot spots do provide a reference frame within which true plate motions can be measured.
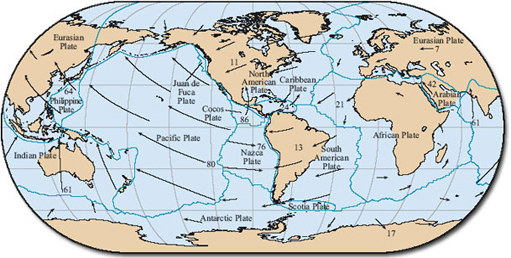
This methodology has been extended to studies of numerous hot-spot trails on other plates. Combined with a knowledge of relative plate motions between adjacent plates, such measurements have allowed the development of a framework of true plate motions across the globe, which are summarised in Figure 25.