3.2 Heat flow within plates
As newly formed lithosphere moves away from an oceanic ridge, it gradually cools and heat flow (Box 2) decreases away from constructive plate boundaries.
Question 4
If a body cools, what happens to its density?
Answer
It contracts, so its volume decreases, resulting in an increase in density.
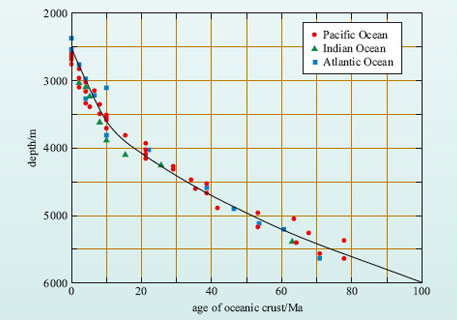
The cooling and shrinking of the lithosphere result in an increase in its density and so, as a result of isostasy, it subsides into the asthenosphere and ocean depth increases away from the ridge, from about 2-3 km at oceanic ridges to about 5-6 km for abyssal plains. Indeed, one of the more remarkable observations of ocean-floor bathymetry is that ocean floor of similar age always occurs at similar depths beneath sea level (Figure 10). The relationship between mean oceanic depth (d in metres) and lithosphere age (t in Ma) can be expressed as:
d = 2500 + 350t½ ( 1 )
If the depth of the ocean floor can be determined, then the approximate age of the volcanic rocks from which it formed may also be estimated, and vice versa.
Activity 4
The ocean depth at a distance of 1600 km from the Mid-Atlantic Ridge is 4700 m.
-
(a) Calculate:
-
(i) the age of the crust at this location
-
(ii) the mean spreading rate represented by this age.
-
-
(b) Is this a half or a full spreading rate?
Answer
(a) (i) Rearranging Equation 1:
The age of the crust at this location is 40 Ma.
(a) (ii) The mean spreading rate is given by distance divided by time: ![]()
(b) This is a half spreading rate because it refers to one side of the constructive margin only.
Box 2: Earth's heat flow
The sources of Earth's internal heat are:
-
heat remaining from the initial accretion of the Earth
-
gravitational energy released from the formation of the core
-
tidal heating
-
radiogenic heating within the mantle and crust.
Although the proportion of each heat source cannot be determined accurately, radiogenic heat is considered to have been the major component for much of the Earth's history. There are three main processes by which this internal heat gets to the Earth's surface, these being conduction, convection and advection.
Heat flow (or heat flux), q, is a measure of the heat energy being transferred through a material (measured in units of watts per square metre; W m−2). It may be determined by taking the difference between two or more temperature readings (ΔT) at different depths down a borehole (d), and then determining the thermal conductivities (k) of the rocks in between. q can then be calculated according to the relationship:
Earth scientists are interested in the heat flow measured at the Earth's surface because it reveals important information concerning the nature of the rocks and the processes that affect the lithosphere.
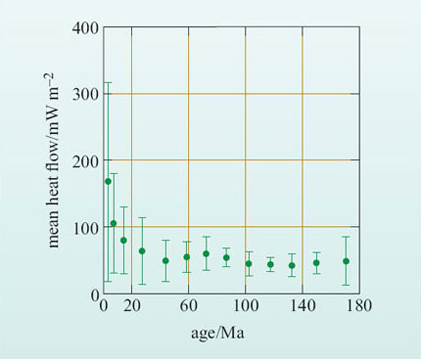
The total annual global heat loss from the Earth's surface is estimated as 4.1-4.3 × 10¹³ W. This yields an average of q ≥ 100 mW m−2 (milliwatts per square metre), though individual measurements may be much higher than this. However, values of q decrease to less than 50 mW m(2 for oceanic crust older than 100 Ma (Figure 11). In continental areas, the younger crust (i.e. mountain belts that are less than 100 Ma) have relatively high values of q, which are 60-75 mW m−2, whilst old continental crust and cratons have much lower heat flow values, averaging q = 38 mW m−2. Thus, variations in heat flow are closely related to different types of crustal materials and, importantly, different types of tectonic plate boundary.
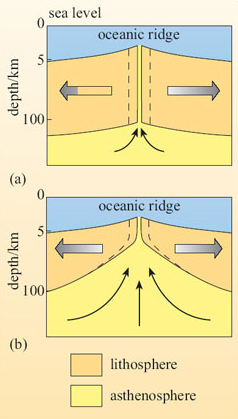
There are two general models for the thermal evolution of the oceanic lithosphere: the plate model and the boundary-layer (or half-space) model.
-
The plate model (Figure 12a) assumes that the lithosphere is produced at a mid-ocean ridge with constant thickness and that the temperature at the base of the plate corresponds to its temperature of formation.
-
The boundary-layer model (Figure 12b) assumes that the lithosphere does not have a constant thickness, but thickens and subsides as it cools and moves away from the ridge. This is achieved by loss of heat from the underlying asthenosphere, which progressively cools below the temperature at which it can undergo solid-state creep and is transformed from asthenosphere to lithosphere.
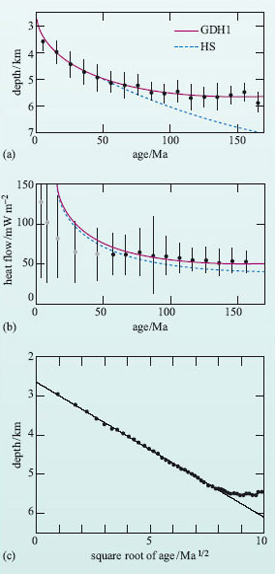
The thermal consequences of these two models can be calculated from a knowledge of the temperature of the mantle at depth (the geotherm) and the thermal conductivity of the rocks in the lithosphere. As it turns out, both models predict similar results for both heat flow and ocean depth, as shown in Figure 13.
Activity 5
Study Figure 13(c) and then answer the following questions:
-
(a) Is the correlation between depth and the square root of the age of the lithosphere positive or negative?
-
(b) At what age does the relationship depart from a linear correlation?
-
(c) Does this departure imply that older oceanic lithosphere is warmer or cooler than predicted from the simple, linear boundary-layer model?
Answer
-
(a) Ocean depth increases with the square root of lithosphere age so the correlation is positive.
-
(b) The departure from linearity occurs between 8 and 9 on the horizontal scale, which is equivalent to an age of 64-81 Ma.
-
(c) For crust older than 64 Ma, ocean depth is less than predicted, i.e. the ocean floor is shallower, implying that it is warmer than predicted by the boundary-layer model.
Both models predict the observed linear variation between ocean depth and the square root of age of the lithosphere, showing that the oceanic lithosphere cools and subsides as it ages away from a spreading centre. However, the plate model fits the data better for older lithosphere (>60 Ma), suggesting that once lithosphere has cooled to a certain thickness, the thickness remains more-or-less constant until the plate is subducted.
Both models also predict greater heat flow from young oceanic crust than that observed in the ocean basins, as shown in the example in Figure 13b.
Question 5
What do you think the cause of this difference might be?
Answer
The thermal models are based on the assumption that heat is lost by conduction only, whereas in reality other mechanisms of heat transfer might be in operation.
The formation of oceanic lithosphere involves contact between hot rocks and cold seawater. As the rocks cool and fracture, they allow seawater to penetrate the young, hot crust to depths of at least a few kilometres. During its passage through the crust the seawater is heated before being cycled back to the oceans. This process is known as hydrothermal circulation and the development of submarine hydrothermal vents ('black smokers') close to mid-ocean ridges is the most dramatic expression of this heat transfer mechanism. However, less dramatic but probably equally significant lower temperature circulation continues well beyond the limits of oceanic ridges and contributes to heat loss from the crust up to 60 Ma after formation.
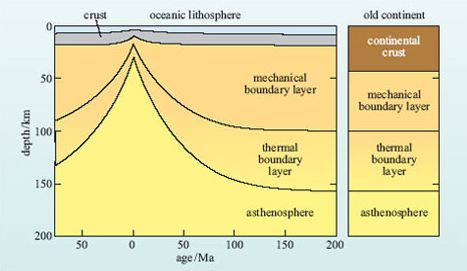
The geophysical evidence from seismology and isostasy suggests that the oceanic lithosphere increases in thickness as it ages until it reaches a maximum of about 100 km. By contrast, bathymetry and heat flow indicate a more constant thickness for older plates. To explain these observations, a plate structure such as that shown in Figure 14 has achieved wide acceptance. The plate is divided into two layers: an upper, rigid mechanical boundary layer and a lower, viscous thermal boundary layer. Both layers thicken progressively with time until the lithosphere is about 80 Ma old, after which the thermal boundary layer becomes unstable and starts to convect. Convection within this layer provides a constant heat flow to the base of the mechanical boundary layer. Thus old lithosphere maintains a constant thickness because the heat flow into its base, and hence the basal temperature, is maintained by convection.