
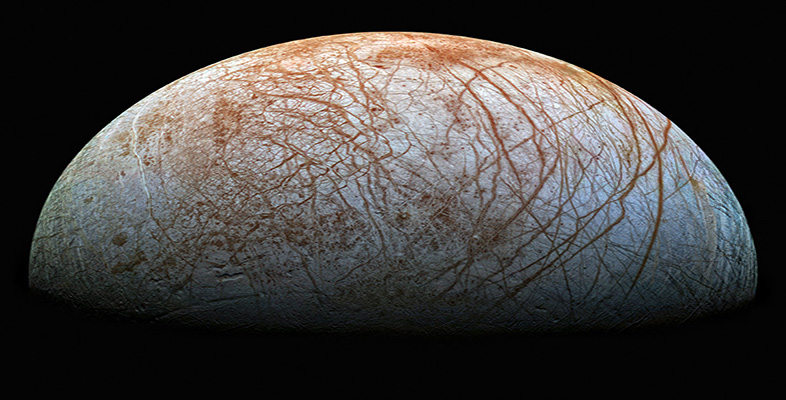
2.3.4 More surface disruption
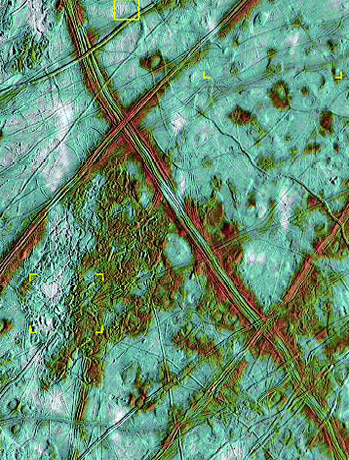
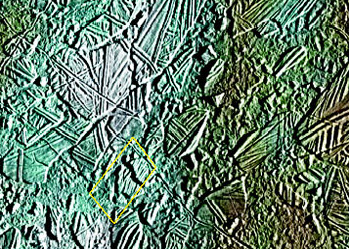
Now let's examine some detailed images of the region of Europa's northern hemisphere that was indicated on Figure 17 (see Section 2.3.2). A medium resolution image is shown in Figure 21, and higher resolution images from within this area are shown in Figures 22-24 (see below).
Click here for a bigger version of Figure 21.
Click here for a bigger version of Figure 22.
Question 9
Study Figure 21. How would you classify the majority of the surface in this region, including the part of it shown in more detail in Figure 22?
Answer
Although Figure 22 includes more variation in size of ridges and grooves than in the comparable sized area shown in Figure 19b (see Section 2.3.3), this and most of the area of Figure 21 has the basic 'ball of string' texture.
Question 10
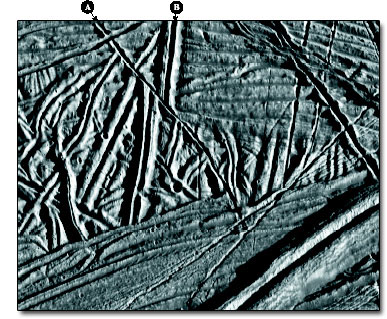
Look at the two features labelled A and B in Figure 22. A is a groove with a slightly raised rim on either side, running diagonally down to the right from the top of the image. B is a ridge, with a groove down its centre, running almost directly down from the top. Try to account for the relationship between these two features where they cross, and deduce which of these two features is the younger.
Answer
Feature A cuts across feature B, and so feature A must be the younger of the two. Moreover, the parts of feature B on either side of feature A are no longer aligned. They have been displaced to the right by nearly 1 km. The simplest explanation of this is that feature A is a fault with about 1 km of sideways movement across it (a geologist would describe it as a dextral (or right-lateral) strike-slip fault). You can get the same impression of displacement to the right where feature A offsets the edge of the relatively smooth surface in the lower third of the image. (Note that although A is younger than B, A is certainly not the youngest ridge or groove in this area: for example, an even younger groove cuts through A at right angles near the top of the image.)
These images provide clear evidence that tectonics on Europa involve relative sideways movements as well as simple spreading apart of the surface.
If you are familiar with plate tectonics on Earth you will probably not be surprised by this. Now turn your attention to the other parts of Figure 21, notably those covered by Figures 23 and 24.
Click here for a larger version of Figure 23.
Click here for a larger version of Figure 24.
Question 11
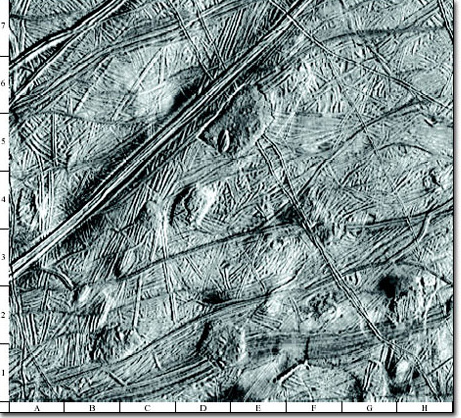
What has happened to the 'ball of string' texture in (a) Figure 23, and (b) Figure 24?
Answer
(a) It is obvious that the 'ball of string' texture once covered the whole of the area shown in Figure 23. However, there are many patches about 10 km across where this texture can be seen in various degrees of disruption. For example:
(i) in square D4 the 'ball of string' surface has been warped upwards into a gentle dome, with a zig-zag fracture where its roof has been stretched apart;
(ii) in squares D/E-5/6 the 'ball of string' surface has been destroyed in a roughly rectangular area, except for a 4 km × 2 km fragment that survives near the southwest edge of the disrupted area. The surface of this whole disrupted area is domed upwards, but its edge must be lower than the surrounding terrain because it is surrounded by an inward-facing cliff;
(iii) in squares D/E-l/2 there is a dome that looks like a mushy extrusion across the original surface within which no identifiable traces of 'ball of string' texture remain.
Sites (i)-(iii) can be regarded as progressively more disrupted examples of 'ball of string texture'. A dome intermediate in character between those at sites (ii) and (iii) occurs at B1-B2. You may also be able to make out several more subtle domes within which the surface has not been fractured at all (in Figure 23 and nearby parts of Figure 21).
(b) Throughout Figure 24, the 'ball of string' surface has been fractured into slabs, which are bounded by cliffs and so stand higher than the intervening surface, which is occupied by hummocks a few hundred metres across. The slabs still retain their 'ball of string' texture, and by matching prominent ridges and grooves on adjacent slabs it is possible to see that the slabs in the northwest (top left) of the image have been jostled apart by distances of about 1 km. However, the further southeast you look in this image, the harder it is to identify matching slabs and the greater the proportion of new, low-lying, hummocky surface.
The usual explanation for the dome features in regions such as Figure 23 is that they are places where warm buoyant material (which could be warm ice, slush or water) has risen from below. Where injected as an intrusion at shallow depth, the result is a subtle dome (e.g. the example in D4) over which the surface may have been sufficiently stretched to rupture. In more extreme cases the 'ball of string' surface appears to have melted, exposing the risen material, which is surrounded by cliffs that drop down to the new surface (e.g. the example in D/E-5/6). Elsewhere the risen material seems to have spread out across the top of the old 'ball of string' surface (e.g. the example in D/E-1/2). Regions such as the one covering Figure 24 are essentially just more extensive versions of the D/E-5/6 situation, and demonstrate the effects of heating events on a regional scale. There are several examples of this type of terrain on Europa, which is described formally as chaos. Conventionally, within a chaos region, the slabs of 'ball of string' surface are referred to as 'rafts' and the low-lying hummocky material in between is called 'matrix'.
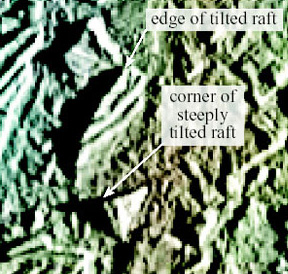
The matrix is most simply interpreted as the (now refrozen) surface of an ocean that was exposed when the overlying ice was removed, presumably by melting caused by an injection of heat from below. Near the edges of chaos, rafts have broken away from the continuous ice sheet and drifted inwards by relatively small distances, and in many cases their original configurations can be deduced. Near the centres of chaos, rafts are less abundant and it is not usually possible to see how they once fitted together. The rafts are analogous to ice floes formed in the Earth's oceans when floating pack-ice breaks up in the spring. The even height of the cliff at the edge of most rafts shows that these rafts are lying horizontally. However, there is one raft, 5 km × 2 km in size, just to the northeast of the centre of Figure 24 with (to judge by the cliff's shadow) an exceptionally high cliff on its northwest side but no sign of a cliff on its southeast side. This raft is shown enlarged in Figure 25. It looks as though the raft has been tilted down towards the southeast. Some of the knobbly hills sticking up out of the matrix may be the corners of smaller or more steeply tilted rafts, the most obvious being a triangular hill with an exceptionally long shadow immediately to the south of the tilted raft in Figure 25.
Chaos makes up about a third of the nine per cent of Europa's surface that has been imaged at adequate resolution (less than about 200 m per pixel) to make identification certain. On low-resolution images, both chaos and dome-disrupted regions such as Figure 23 appear as mottled terrain like the area in the northeast of Figure 16 (see Section 2.3.1). The region covered by Figure 24 is named Conamara Chaos, and as you can see on Figure 21 it extends for about 100 km north to south and about 80 km east to west. (Conamara Chaos is named after a region in the west of Galway, Ireland - usually spelt Connemara in English. The name derives from Conmaicne mara, meaning the seaside land of the descendants of Conmac. In Irish legend, Conmac was a son of Fergus Mòr, king of Ulster, and Maedhbh, queen of Connacht.) The largest chaos region on Europa is more than a thousand kilometres across, and the small end of the size spectrum is exemplified by the resurfaced area at D/E-5/6 in Figure 23.
Question 12
If large chaos regions are places where 'ball of string' surface has been destroyed, what could be their significance for the global tectonics of Europa?
Answer
Destruction of surface in chaos regions could balance the spreading implied by the creation of the 'ball-of-string' texture. We noted earlier that such spreading could not occur unless it was matched globally by the surface being destroyed at an equal rate. On Earth, this is achieved where plates are subducted deep into the mantle.
It is hard to imagine how we could prove that formation of chaos in one part of Europa is accompanied simultaneously by addition of new ridges and grooves to 'ball of string' textured regions elsewhere, unless we actually could see it happening. However, recognition of chaos does at least show how a balance could be achieved between the creation and destruction of surface.
So how old is Conamara Chaos?
Question 13
Look carefully at Figure 24. Is the white ejecta from Pwyll visible on top of the matrix as well as on top of the rafts and, if so, what does this tell us about the relative ages of the chaos and Pwyll?
Answer
Both rafts and matrix in the western part of Figure 24 are white, in contrast to redder surfaces in the east. This is because raft and matrix surfaces alike have been overlain by a sprinkling of ray ejecta from Pwyll. This is also apparent on Figure 21. The fact that the matrix has ejecta on top of it means that the chaos existed before Pwyll was formed. As noted earlier in Section 2.3.2, Pwyll is probably about 3 million years old, so this is the likely lower age limit for Conamara Chaos.
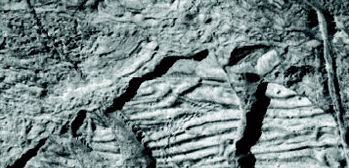
In addition to the white ray ejecta, there are quite a few craters less than 1 km in diameter in this region. These are more common within the rays, and so are almost certainly secondary craters produced by impact of the largest blocks of ejecta expelled from Pwyll. On Figure 24, these craters appear more common on the rafts than in the matrix. This difference could be apparent rather than real, because the jumbled surface texture of the matrix would make the craters difficult to see. However, even on the highest resolution images such as Figure 26 craters appear scarcer on the matrix. Some of the small craters on the rafts must pre-date the break-up into chaos, but if most of the small craters we see are Pwyll secondaries then some of those that formed on the matrix since its creation would seem to have been erased. One way this could have happened is if the matrix remained mobile and continued to deform for some millions of years after its surface froze, whereas the surfaces of the rafts were rigid for the whole time.
So, the evidence so far points to Conamara Chaos having formed (probably at least 3 million years ago) by melting of a patch of ice some tens of kilometres across, accompanied by break-up of the adjacent floating ice into rafts, some of which drifted inwards across the temporarily unroofed ocean. A skin of ice or slush would have rapidly covered any exposed water but, depending on the amount of heating from below, this skin could have remained sufficiently pliant to allow the rafts to plough through it for up to several million years. Before the matrix became fully rigid, ejecta from the Pwyll impact was distributed across the area, with the accompanying formation of secondary impact craters. Continuing deformation or local resurfacing of the matrix was sufficient to erase a significant proportion of the Pwyll secondary craters on the matrix.
But that is not quite the end of the story.
Question 14
Examine Figure 24 again, and locate a groove that runs diagonally across the image from just below the northwest (top left) corner. Look closely at the units this groove cuts. Deduce the implications for the age of this groove and the nature of the material that it cuts.
Answer
The groove cuts through rafts and matrix alike. Its appearance on the rafts is unremarkable, and it would be taken for just another element of each raft's 'ball of string' texture if we did not see it also cutting the matrix. Generally speaking, the groove's course is not deflected where it crosses from one surface type to another. This groove must have formed at a time when the matrix had become virtually as rigid as the rafts. It is seen cutting the matrix near the right-hand edge of Figure 26. There are at least two other grooves cutting the matrix in Figure 24. One runs parallel to the first groove, about 5 km to its southwest. The other is at right angles to the first groove, which cuts it about 5 km from the northwest corner of the image.
You have now seen the last major piece of the puzzle. After its matrix has become sufficiently rigid, chaos on Europa begins to experience brittle fracturing, and new grooves form that look similar to some of those on ordinary 'ball of string' terrain. Perhaps, given sufficient time, rafts and matrix alike in a chaos region will become thoroughly overprinted by additional generations of ridges and grooves, and the rafts so split up by successive spreading increments across each crack that they lose their integrity. The entire area will take on the appearance of a ball of string - in fact, it will actually be 'ball of string' terrain. For all we know, areas such as those in Figures 19 (see Section 2.3.3) and 22 could be former chaos of which no recognisable traces remain.
Chaos areas, and in particular the drifted rafts, are compelling evidence that, at least at the time of chaos formation, the 'ball of string' textured surface ice was floating on a liquid. This would not have to be an ocean of global extent, because the underlying liquid would not need to cover an area much wider than the overlying chaos.
In Section 2.5, we will argue that whether the ocean is global, local, permanent or ephemeral is of no great importance for the existence of life. However, first let's see if we can work out how thick the ice is.