

2.3 More than two numbers
The idea of a weighted mean can be extended to more than two numbers. To see how the calculation is done in general, remind yourself first how we calculated the weighted mean of two numbers and with corresponding weights and .
Multiply each number by its weight to get the products and .
Sum these products to get .
Sum the weights to get .
Divide the sum of the products by the sum of the weights.
This leads to the following formula.
Weighted mean of two or more numbers
The weighted mean of two or more numbers is
This is the formula which is used to find the weighted mean of any set of numbers, each with a corresponding weight.
Example 12 A weighted mean of wine prices
Suppose we have the following three batches of wine prices (in pence per bottle).
We want to calculate the weighted mean of these three batch means using, as corresponding weights, the three batch sizes. Rather than applying the formula directly, the calculations can be set out in columns.
| Batch | Number (batch mean) | Weight (batch size) | Number weight ( = product) |
|---|---|---|---|
Batch 1 |
525.5 |
6 |
3 153.0 |
Batch 2 |
468.0 |
2 |
936.0 |
Batch 3 |
504.2 |
12 |
6 050.4 |
Sum |
20 |
10 139.4 |
The weighted mean is
We round this to the same accuracy as the original means, to get a weighted mean of 507.0. (Note that this lies between 468.0 and 525.5. This is a useful check, as a weighted mean always lies within the range of the original means.)
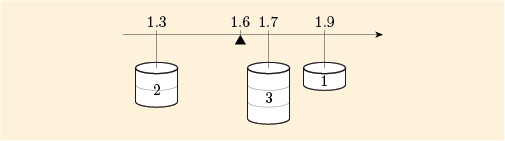
The physical analogy in Example 12 can be extended to any set of numbers and weights. Suppose that you calculate the weighted mean for:
This is given by
This is pictured in Figure 11, with the point of balance for these three weights shown at 1.6.
You will meet many examples of weighted means of larger sets of numbers in Subsection 5.2, but we shall end this section with one more example.
Example 13 Weighted means of many gas prices
Example 11 showed the calculation of a weighted mean of gas prices using, for simplicity, just the two cities London and Edinburgh. We can extend Example 11 to calculate a weighted mean of all 14 gas prices from Table 3, using as weights the populations of the 14 cities. The calculations are set out in Table 5.
| City | Price (p/kWh): | Weight: | Price weight: |
|---|---|---|---|
Aberdeen |
3.740 |
19 |
71.060 |
Edinburgh |
3.740 |
42 |
157.080 |
Leeds |
3.776 |
150 |
566.400 |
Liverpool |
3.801 |
82 |
311.682 |
Manchester |
3.801 |
224 |
851.424 |
Newcastle-upon-Tyne |
3.804 |
88 |
334.752 |
Nottingham |
3.767 |
67 |
252.389 |
Birmingham |
3.805 |
228 |
867.540 |
Canterbury |
3.796 |
5 |
18.980 |
Cardiff |
3.743 |
33 |
123.519 |
Ipswich |
3.760 |
14 |
52.640 |
London |
3.818 |
828 |
3161.304 |
Plymouth |
3.784 |
24 |
90.816 |
Southampton |
3.795 |
30 |
113.850 |
Sum |
1834 |
6973.436 |
The entries in the weight column, , are the approximate populations, in 10 000s, of the urban areas that include each city (as measured in the 2001 Census). For each city, we multiply the price, , by the weight, , to get the entry in the last column, .
The weighted mean of the gas prices using these weights is then
or, in symbols,
As and , the weighted mean is
So the weighted mean of these gas prices, using approximate population figures as weights, is 3.802p per kWh.
Note that this weighted mean is larger than all but three of the gas prices for individual cities. That is because the cities with the two highest populations, London and Birmingham, also have the highest gas prices, and the weighted mean gas price is pulled towards these high prices.
Although the details of the calculation above are written out in full in Table 5, in practice, using even a simple calculator, this is not necessary. It is usually possible to keep a running sum of both the weights and the products as the data are being entered. One way of doing this is to accumulate the sum of the weights into the calculator’s memory while the sum of the products is cumulated on the display. If you are using a specialist statistics calculator, the task is generally very straightforward. Simply enter each price and its corresponding weight using the method described in your calculator instructions for finding a weighted mean.
Activity 8 Weighted means on your calculator
Use your calculator to check that the sum of weights and sum of products of the data in Table 5 are, respectively, 1834 and 6973.436, and that the weighted mean is 3.802. (No solution is given to this activity.)
Activity 9 Weighted mean electricity price
Table 6 is similar to Table 5, but this time it presents the average price of electricity, in pence per kilowatt hour (kWh). These data are again for the year 2010 for typical consumers on credit tariffs in the same 14 cities we have been considering for gas prices, with the addition of Belfast. Again, the weights are the approximate populations of the relevant urban areas, in 10 000s.
| City | Price (p/kWh): | Weight: | Price weight: |
|---|---|---|---|
Aberdeen |
13.76 |
19 |
|
Belfast |
15.03 |
58 |
|
Edinburgh |
13.86 |
42 |
|
Leeds |
12.70 |
150 |
|
Liverpool |
13.89 |
82 |
|
Manchester |
12.65 |
224 |
|
Newcastle-upon-Tyne |
12.97 |
88 |
|
Nottingham |
12.64 |
67 |
|
Birmingham |
12.89 |
228 |
|
Canterbury |
12.92 |
5 |
|
Cardiff |
13.83 |
33 |
|
Ipswich |
12.84 |
14 |
|
London |
13.17 |
828 |
|
Plymouth |
13.61 |
24 |
|
Southampton |
13.41 |
30 |
|
Sum |
Use these data to calculate the weighted mean electricity price. (Your calculator will almost certainly allow you to do this without writing out all the values in the column.)
Discussion
The table showing the required sums (and the values in the column, that you may not have had to write down), is as follows.
| City | Price (p/kWh): | Weight: | Price weight: |
|---|---|---|---|
Aberdeen |
13.76 |
19 |
261.44 |
Belfast |
15.03 |
58 |
871.74 |
Edinburgh |
13.86 |
42 |
582.12 |
Leeds |
12.70 |
150 |
1 905.00 |
Liverpool |
13.89 |
82 |
1 138.98 |
Manchester |
12.65 |
224 |
2 833.60 |
Newcastle-upon-Tyne |
12.97 |
88 |
1 141.36 |
Nottingham |
12.64 |
67 |
846.88 |
Birmingham |
12.89 |
228 |
2 938.92 |
Canterbury |
12.92 |
5 |
64.60 |
Cardiff |
13.83 |
33 |
456.39 |
Ipswich |
12.84 |
14 |
179.76 |
London |
13.17 |
828 |
10 904.76 |
Plymouth |
13.61 |
24 |
326.64 |
Southampton |
13.41 |
30 |
402.30 |
Sum |
1892 |
24 854.49 |
Thus , and
So the weighted mean of electricity prices is 13.14p per kWh.