

5.1 What are the CPI and RPI?
The CPI and the RPI are the main measures used in the UK to record changes in the level of the prices most people pay for the goods and services they buy. The RPI is intended to reflect the average spending pattern of the great majority of private households. Only two classes of private households are excluded, on the grounds that their spending patterns differ greatly from those of the others: pensioner households and high-income households. The CPI, however, has a wider remit – it is intended to reflect the spending of all UK residents, and also covers some costs incurred by foreign visitors to the UK.
The CPI and RPI are calculated in a similar way to the price index for Gradgrind Ltd’s energy in Section 4. However, they are calculated once a month rather than just once a year, and are based on a very large ‘basket of goods’. The contents of the basket and the weights assigned to the items in the basket are updated annually to reflect changes in spending patterns (as was the case with Gradgrind’s index for energy prices), and the index is ‘chained’ to previous values. However, once decided on at the beginning of the year, the contents of the basket and their weights remain fixed throughout the year.
For the RPI, the price ratio for the basket each month is calculated relative to the previous January. Then the value of the index is obtained by multiplying the value of the index for the previous January by this price ratio. For example,
The CPI works in much the same way, except that price ratios are calculated relative to the previous December. So, for example,
Since these price indices are calculated from price ratios, they measure price changes in terms of the ratio of the overall level of prices in a given month to the overall level of prices at an earlier date. In practice, data on most prices are collected on a particular day near the middle of the month; the values of the RPI and CPI calculated using these data are referred to simply as the values of the RPI and CPI for the month. For example, the RPI took the value 239.9 in February 2012. This value measures the ratio of the overall level of prices in February 2012 to the overall level of prices on a date at which the index was fixed at its starting value of 100. This date, called a base date, is 13 January 1987 (at the time of writing). Thus the general level of prices in February 2012, as measured by the RPI, was times the general level of prices in January 1987. The base date has no significance other than to act as a reference point. (The CPI base date is 2005 and this refers to the average level of prices throughout 2005, not to a specific date in 2005.)
The RPI and CPI are each based on a very large ‘basket’ of goods and services. (The two baskets are similar, but not exactly the same.) Each contains around 700 items including most of the usual things people buy: food, clothes, fuel, household goods, housing, transport, services, and so on. Each basket is an ‘average’ basket for a broad range of households. The items in the baskets are often grouped into broader categories. For the RPI, the five fundamental groups are: ‘Food and catering’, ‘Alcohol and tobacco’, ‘Housing and household expenditure’, ‘Personal expenditure’ and ‘Travel and leisure’. These groups are divided into 14 more detailed subgroups (which are further divided into sections), as shown in Figure 37. The items in the CPI basket are divided into 12 broad groupings called divisions, which are further subdivided.
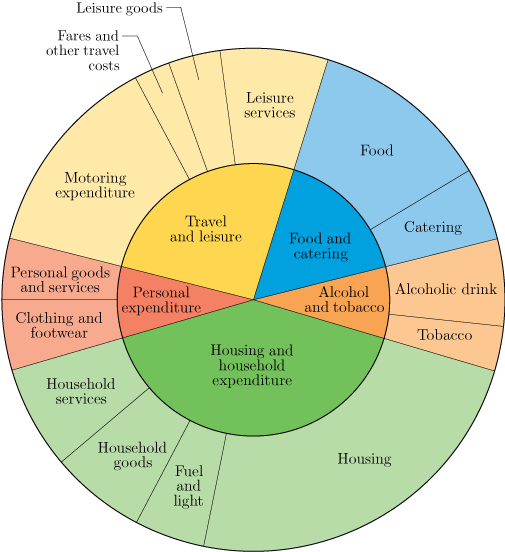
The inner circle shows the five groups, and the outer ring shows the 14 subgroups. Notice that in the inner circle the sector labelled ‘Food and catering’ has been drawn almost twice as large (as measured by area) as that labelled ‘Alcohol and tobacco’. This reflects the fact that the typical household spends nearly twice as much on food and catering as on alcohol and tobacco. The weight of an item or group reflects how much money is spent on it. So the weight of the ‘Food and catering’ group is almost twice that of ‘Alcohol and tobacco’.
The outer ring represents the same total expenditure as the inner circle, but in more detail. For example, in the outer ring the area labelled ‘Food’ (which mostly consists of food bought for use in the home) is more than twice as large as that labelled ‘Catering’ (which includes meals in restaurants and canteens, and take-away meals and snacks), reflecting the fact that the typical household spends more than twice as much on food as on catering; the weight of the subgroup ‘Food’ is more than double the weight of the subgroup ‘Catering’. The chart gives a good indication of average spending patterns in the UK in the early 21st century.
Activity 19 The expenditure of a typical household
(a) Using Figure 37, estimate roughly what fraction of the expenditure of a typical household is on each of the following groups and subgroups:
Personal expenditure
Housing and household expenditure
Housing
Discussion
What you need to remember here is that the size of an area represents the proportion of expenditure on that class of goods or services. (Also, it is admittedly not very easy to estimate these areas ‘by eye’! Your estimates might quite reasonably differ from those given here.)
The sector for ‘Personal expenditure’ looks as if it is approximately a tenth of the whole inner circle – so approximately a tenth of total expenditure is personal expenditure.
‘Housing and household expenditure’ looks as if it is somewhere between a third and a half of the inner circle – perhaps approximately two fifths – so approximately two fifths of expenditure is on housing and household expenditure.
The area for ‘Housing’ takes up about a quarter of the outer ring, so about a quarter of expenditure is on housing.
(b) Suppose that a household spends a total of £540 per week on goods and services that are covered by the RPI. Use your answers to part (a) to estimate very approximately how much is spent each week on each of the groups and subgroups in part (a).
Discussion
The amount spent each week on ‘Personal expenditure’ is approximately
The amount spent each week on ‘Housing and household expenditure’ is approximately
The amount spent each week on ‘Housing’ is approximately
Recall, however, that the weights represent average proportions of expenditure, and the spending patterns of the selected household may differ from those of the ‘typical’ household.
To ensure that the basket of goods for the index reflects the proportion of average spending devoted to different types of goods and services, it is necessary to find out how people actually spend their money. The Living Costs and Food Survey (LCF) records the spending reported by a sample of 5000 households spread throughout the UK. Data from the LCF are used to calculate the weights of most of the items included in the RPI basket. Since 1962, the weights have been revised each year, so that the index is always based on a basket of goods and services that is as up to date as possible. Because of this regular weight revision, the index is chained (as was the Gradgrind Ltd index).
(Most of the weights for the CPI come from a different source, the UK National Accounts, though in turn this source is partly based on data from the LCF. Again, the weights are revised each year.)
The weight of a group or subgroup directly depends on the average expenditure of households on that item. In Subsection 2.1, you saw that it is only the relative size of the weights that affects the value of the weighted mean – this is Rule 1 for weighted means. So instead of using the average expenditure of an item as its weight, the expenditure figures for the items can all be multiplied by the same factor to produce a new, more convenient, set of weights. For the RPI, this factor is chosen so that the sum of the weights is 1000. Table 12 shows the 2012 weights used in the RPI for the groups and subgroups. Notice that each group weight is obtained by summing the weights for its subgroups.
| Group | Subgroup | Weight | Group weight |
|---|---|---|---|
Food and catering |
Food |
114 |
|
Catering |
47 |
161 |
|
Alcohol and tobacco |
Alcoholic drink |
56 |
|
Tobacco |
29 |
85 |
|
Housing and household expenditure |
Housing |
237 |
|
Fuel and light |
46 |
||
Household goods |
62 |
||
Household services |
67 |
412 |
|
Personal expenditure |
Clothing and footwear |
45 |
|
Personal goods and services |
39 |
84 |
|
Travel and leisure |
Motoring expenditure |
131 |
|
Fares and other travel costs |
23 |
||
Leisure goods |
33 |
||
Leisure services |
71 |
258 |
|
All items (i.e. the sum of the weights) |
1000 |
||
The following checklist provided contains the major categories of goods and services included in the RPI. In the next activity, you will be asked to complete the last three columns of this checklist to make rough estimates of your household’s group weights.
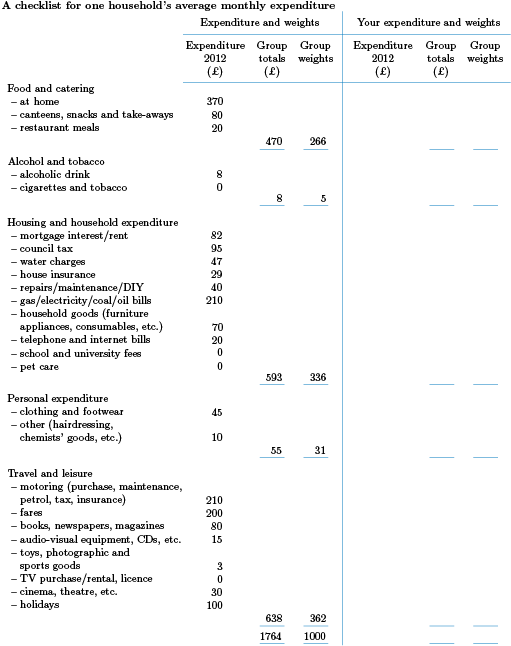
The figures already in the checklist were completed for a two-person household. Some of the figures were accurate, others were necessarily very rough estimates. Nevertheless, the household’s weights give a reasonable indication of the proportion of the household’s expenditure (in 2012) on the five main groups used in the RPI.
The total expenditure was £1764. So the group weights were calculated by multiplying all the group total expenditures by a constant factor of 1000/1764, to ensure the weights sum to 1000. The weight for ‘Food and catering’, for example, is
Another way to calculate this is to multiply the proportion of monthly expenditure spent on food and catering by 1000. The proportion is
Since the total weight is 1000, the weight for ‘Food and catering’ is
Notice that the group weights for this particular household differ quite considerably from those used in the RPI in 2012 (see Table 12). For instance, a much greater proportion of expenditure is on ‘Food and catering’ and a much smaller proportion is spent on ‘Alcohol and tobacco’.
Activity 20 Your own household’s expenditure
Make rough estimates of your own household’s expenditure last year and complete the final columns of the checklist in Figure 38 (Word version provided [Tip: hold Ctrl and click a link to open it in a new tab. (Hide tip)] ). For some categories, you may find it easier just to make a rough estimate of, say, your annual expenditure and then divide by 12. If you have no idea at all for a category, then use the corresponding figure in the checklist as a starting point for your own expenditure and adjust it up or down depending on how you think you spend your money. One way of checking that your figures are sensible is to consider how the sum of the expenditures relates to your household’s monthly income. Do not spend more than 15 minutes on estimating your expenditure; accurate figures are not needed.
Divide each group expenditure by your monthly expenditure total and then multiply by 1000 to calculate your household’s group weights.
How do your household’s weights compare with those used in the RPI in 2012?
Discussion
Every household will be different, but think about the reasons for any large differences between your weights and those for the RPI.