

4.1 A two-commodity price index
Section 5 includes an outline of how the information used to calculate the official UK price indices is collected, and describes how the indices are calculated. To introduce ideas, in this section we describe a very much simpler example of a price index calculation. It uses exactly the same basic method of calculation as the actual Retail Prices Index. (Not every index is calculated in this way.)
The context is a mythical computing company, Gradgrind Ltd.
Gradgrind Ltd uses both gas and electricity in its operations. Table 7 shows the price they paid for each fuel in 2007 and 2008. The prices are shown in £ per megawatt hour (MWh). (It is more usual, in the UK, for prices to be quoted in pence per kilowatt hour (p/kWh). Here, £/MWh have been used simply to make some of the later calculations a little more straightforward. Because there are 100 pence in £1 and 1000 kilowatts in a megawatt, £10/MWh is exactly the same price as 1p/kWh – so Gradgrind’s gas price in 2007, for instance, was 2.4p/kWh.)
| Energy type | 2007 | 2008 |
|---|---|---|
Gas (£/MWh) |
24 |
29 |
Electricity (£/MWh) |
76 |
87 |
If we were interested in looking at the change in price of just one of these fuels, say gas, things would be relatively straightforward. For instance, it might well be appropriate to look at the increase in price as a percentage of the price in 2007.
Activity 14 Gradgrind’s gas price increase
Work out the increase in Gradgrind’s gas price between 2007 and 2008 as a percentage of the 2007 price.
Discussion
The increase (in £/MWh) is . This is as a proportion of the 2007 price. That is, of the 2007 price. Or you might have worked this out by finding that the 2008 price is of the 2007 price, so that again the increase is 20.8% of the 2007 price.
So we could say that, for this company at least, gas has gone up by 20.8%. In other words, for every £1 they spent on gas in 2007, they would have spent £1.208 in 2008 if they had bought the same amount of gas in each year. Or putting it another way, for every 100 units of money (pence, pounds, whatever) they spent in 2007, they would have spent 120.8 units of money in 2008 if they had bought the same amount. So a way of representing this price change would have been to define an index for the gas price such that it takes the value 100 for 2007, and 120.8 for 2008.
Notice that the value of the gas price index for 2008 could be calculated as
That is, the value of the index in one year is the value of the index in the previous year multiplied by a price ratio, in this case the gas price ratio for 2008 relative to 2007. This ratio, as a number, is 1.208.
But Gradgrind did not only use gas, they used electricity as well, and the aim here is to find a representation of their overall fuel price change, not just the change in gas prices.
An electricity price ratio for 2008 relative to 2007 can be worked out, like the gas price ratio. It is .
Activity 15 Gradgrind’s electricity price index
Use the electricity price ratio above to find the increase in Gradgrind’s electricity price between 2007 and 2008 as a percentage of the 2007 price. What would the 2008 value be for a price index of Gradgrind’s electricity price alone, calculated in the same way as the gas price index (with 2007 as the base year)?
Discussion
The 2008 electricity price is of the 2007 price, so that the increase is 14.5% of the 2007 price.
The 2008 value of the electricity price index is
But this has got us no further in finding a price index that simultaneously covers both fuels.
One possibility might be to look at how Gradgrind’s total expenditure on these two fuels changed from 2007 to 2008. The expenditures are given in Table 8.
| Energy type | 2007 | 2008 |
|---|---|---|
Gas |
9 298 |
8 145 |
Electricity |
3 205 |
2 991 |
Total |
12 503 |
11 136 |
This seems not to have helped. The total expenditure went down, but you have already seen that the prices of both gas and electricity went up.
Activity 16 How much fuel did Gradgrind use?
Use the data in Tables 7 and 8 to find the quantity of each fuel that Gradgrind used in 2007 and 2008 (in MWh). Hence explain why the energy expenditure fell.
Discussion
The expenditure on a particular fuel in a particular year can be calculated as . Therefore, if the expenditure and price are known, the quantity used can be calculated as
In 2007, Gradgrind’s gas cost £24 per MWh, and they spent £9298 on gas, so the amount of gas they used in MWh was
The other amounts, in MWh, are found in a similar way, and all are shown in the following table.
| Energy type | 2007 | 2008 |
|---|---|---|
Gas |
387.4 |
280.9 |
Electricity |
42.2 |
34.4 |
The reason that the expenditures went down is simply that Gradgrind used less of each fuel in 2008 than in 2007.
Remember the aim is to produce a measure of price changes. So looking at expenditure changes does not do the right thing, since expenditure depends on the amount of fuel consumed as well as the price.
One possibility might be as follows. We could work out how much Gradgrind would have spent on fuel in 2008 if the consumptions of both fuels had not changed from 2007. That would remove the effect of any changes in consumption. Then we could calculate an overall energy price ratio for 2008 relative to 2007 by dividing the total expenditure on energy for 2008 (using the 2007 consumption figures) by the total expenditure on energy for 2007 (again using the 2007 consumption figures).
You should have found, in Activity 16, that the quantities of gas and electricity consumed in 2007 were, respectively, 387.4 MWh and 42.2 MWh. To buy those quantities at 2008 prices would have cost (in £): for the gas and for the electricity, giving a total expenditure of
So a reasonable overall energy price ratio for 2008 relative to 2007 can be found by dividing this total by the 2007 total expenditure, again calculated using the 2007 consumptions. The appropriate figure for 2007 is just the actual total expenditure, which (in £) was (see Table 8). This gives an overall energy price ratio for 2008 relative to 2007 as
Now we have an appropriate price ratio, the Gradgrind energy price index can be set as 100 for the base year, 2007, and the value of the 2008 index is found by multiplying the 2007 index value by the price ratio:
This is indeed how a chained index of this kind is calculated – but the calculations are rather messy. You might be wondering whether it would be simpler to calculate the overall energy price ratio as a weighted mean of the two price ratios for the two fuels, in much the same way that weighted means were used to combine prices in Section 2. If you did think this, you would be right – and furthermore, the resulting overall energy price ratio is exactly the same as has just been found, if we make the right choice of weights. The overall energy price ratio for 2008 relative to 2007 is just a weighted mean of the two price ratios for gas and electricity, with the 2007 expenditures as weights.
Just to show it really does come to the same thing, let us see how it works with the numbers, using the formula for weighted means in Subsection 2.3.
| Energy type | Price ratio (2008 relative to 2007): | Weight (2007 expenditure): |
|---|---|---|
Gas |
1.208 |
9298 |
Electricity |
1.145 |
3205 |
The weighted average of these price ratios is
giving the same value for the overall energy price ratio for 2008 relative to 2007 as we found earlier. (And this is not some sort of fluke that applies only to these particular numbers; it can be shown mathematically that it always works.)
Activity 17 Gradgrind’s energy price ratio for 2009 relative to 2008
| Energy type: price and expenditure | 2008 | 2009 |
|---|---|---|
Gas price (£/MWh) |
29 |
30 |
Gas expenditure (£) |
8 145 |
23 733 |
Electricity price (£/MWh) |
87 |
98 |
Electricity expenditure (£) |
2 991 |
2 275 |
(a) Using the data in Table 9, calculate the price ratios for gas and for electricity, in each case for 2009 relative to 2008.
Discussion
The gas price ratio for 2009 relative to 2008 is
The electricity price ratio for 2009 relative to 2008 is
(Over this year, electricity prices rose a lot more than gas prices.)
(b) With the 2008 expenditures as weights, use your answers to part (a) to calculate the overall energy price ratio for 2009 relative to 2008.
Discussion
The overall energy price ratio for 2009 relative to 2008 is
(c) Now see what happens if you use the 2009 expenditures as weights to calculate the overall energy price ratio for 2009 relative to 2008. How do the results of the calculation differ from what you got in part (b)?
Discussion
Using the 2009 expenditures for weights instead of the 2008 expenditures, the overall energy price ratio for 2009 relative to 2008 is
This price ratio is considerably less than the one found in part (b).
(Note that if full calculator accuracy is retained throughout the calculations, the price ratio is 1.043 to three decimal places.)
The reason that the price ratios you calculated in parts (b) and (c) in Activity 17 were so different is that Gradgrind’s ‘energy mix’ changed a lot over the year. Compared with 2008, in 2009 they spent a great deal more on gas but less on electricity. The weighted mean of the gas and electricity price ratios is, in both cases, nearer the price ratio for gas than that for electricity – this is Rule 2 for weighted means – but it is even nearer the gas weighted mean when the 2009 expenditures are used. This is because the weight for gas is proportionally much greater than it is when the 2008 expenditures are used as weights.
This all shows that it does make a difference which expenditures are used as weights. In practice, it is much more common to use the expenditures from the earlier year – 2008 in this case – as weights. In some circumstances, though, there are good reasons for using the later year, or indeed some more complicated set of weights that depend on both expenditures. However, in this course we shall use the expenditures from the earlier year to provide the weights, partly because that matches more closely what is done in calculating the official UK price indices.
Another possibility for weights would have been to continue to use the 2007 expenditures. These were used to find the overall energy price ratio for 2008 relative to 2007 and could be used for later years as well. Again, in some circumstances this would make sense, but here the pattern of Gradgrind’s fuel expenditure has changed a lot over time, and weights should change in consequence. To continue to use the 2007 expenditures for all later years would mean that this change in the relative importance to Gradgrind of the two fuels would never be taken into account. Instead, to obtain the overall energy price ratio from one year to the next, we use the fuel expenditures in the earlier year as weights, so each year the weights change.
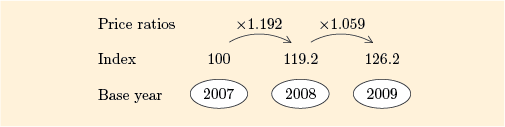
That determines the choice of weights in forming an overall price ratio. Now, how is that used to find the energy price index? Here we simply continue the ‘chaining’ that started when finding the 2008 index: the 2009 index is found by multiplying the value of the index for the previous year, 2008, by the overall energy price ratio for 2009 relative to 2008. The value of the index for 2008 was calculated earlier as 119.2, and (using the weights from the previous year) the overall energy price ratio for 2009 relative to 2008 was found in Activity 17(b) as 1.059. So the value of Gradgrind’s energy price index for 2009 is
(So, in a particular kind of average way, Gradgrind’s energy prices for 2009 have risen by 26.2% since the base year, 2007.)
In general, the value index for a particular year is found by multiplying the value of the index for the previous year by the overall energy price ratio for that year relative to the previous year. This is illustrated in Figure 36.
In the process of chaining, the overall price ratio is calculated anew each year, looking back only at the previous year. The ratio is used to ‘chain’ to earlier years and hence determine the value of the index. This method of calculating a chained price index is summarised below. Although there were only two commodities (gas and electricity) in Gradgrind’s index, this summary is not restricted to two commodities.
Procedure used to calculate a chained price index
For each year calculate the following.
The price ratio for each commodity covered by the index:
The weighted mean of all these price ratios, using as weights the expenditure on each commodity in the previous year. This weighted mean is called the all-commodities price ratio.
For each year, the value of the index is
The value of the index in the first year is set at 100; this date is the base date of the index.
Activity 18 Gradgrind’s energy price index for 2010
Use the data in Table 10, and other necessary numbers from previous calculations, to calculate the value of Gradgrind’s energy price index for 2010.
| Energy type: price and expenditure | 2008 | 2009 |
|---|---|---|
Gas price (£/MWh) |
30 |
28 |
Gas expenditure (£) |
23 733 |
23 969 |
Electricity price (£/MWh) |
98 |
88 |
Electricity expenditure (£) |
2 275 |
2 920 |
Discussion
The gas price ratio for 2010 relative to 2009 is
The electricity price ratio for 2010 relative to 2009 is
(Both price ratios are less than 1 because, over this year, Gradgrind’s gas and electricity prices both fell.)
The overall energy price ratio for 2010 relative to 2009 is
Then the value of the index for 2010 is found by multiplying the 2009 value of the index by this overall price ratio, giving
The Retail Prices Index (RPI), published by the UK Office for National Statistics, is calculated once a month rather than once a year, but the method used is basically that outlined above, though with far more than two commodities. The process of finding the weights in the Retail Prices Index is also more complicated, because it involves taking into account the expenditures of millions of people as measured in a major survey. However, the principles are the same as for Gradgrind. The calculation each January follows exactly this method. In the other 11 months of the year, the calculation is very similar but uses only the increases in prices since the previous January. (See Subsection 5.2 for the details of these calculations.) In the next section, you will learn more about how all this works.