

5.2 Partial solutions
If you struggled a little with the figures in the previous section, you are not alone! Yet scientific tests can get even more complicated than that. For example, we assumed that the blood test referred to in the previous section was completely reliable. But in real life, scientific tests commonly suffer from two types of problem:
- false positives (also known as a ‘Type 1’ error): this is where the test reports something of interest when there is actually nothing.
- false negatives (also known as a ‘Type 2’ error): this is where the test reports nothing of interest when there is actually something.
In addition, the accuracy of a test depends on how common the thing you are interested in (for example, blood type, DNA genotype) is in the population – that is, the base rate.
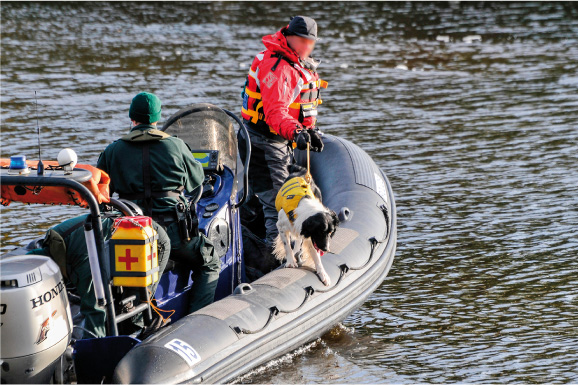
An illustration of this is ‘cadaver dogs’ – dogs that use their sense of smell to indicate whether there has been a dead body at a location. This evidence might be used if there is no longer a body at a suspected crime scene, but the police believe there might have been. For example, in 2013, in the USA, a man was convicted of murdering his wife based in part on the evidence of a cadaver dog, even where there was no body (Ward, 2013).
Investigators are interested in responses from cadaver dogs when:
- a dog correctly indicates that there has been a body and there actually has been one; or
- a dog correctly indicates that there has been no body when there has not been one.
Problematic responses are where:
- a dog wrongly indicates that there has been a body but there has not been one (a false positive); and
- a dog wrongly indicates that there has not been a body but there has been one (a false negative).
Table 1 shows findings from a study on cadaver dog response rates by Jackson et al. (2015, p. 78). As you can see, cadaver dogs are generally quite accurate, but not all the time.
| Dog’s response | Scent actually present | Scent actually absent |
|---|---|---|
| Woof! A body! | 224 | 11 |
| No body | 4 | 115 |
Here, the number 11 represents a false positive, and 4 represents a false negative.
In this next activity, you will be given a chance to try to work out how often cadaver dogs accurately identify a body. A word of reassurance: very few people get this right!
Activity 6 Cadaver detector dogs
Quite often, these sorts of figures will be presented by experts as percentages. This was what you encountered in the previous activity.
Here, the probability of a body if the dog signals is 0.95 (224/224 + 11) or 95%, and the probability of a body if the dog does not signal is 0.03 (4/ 4 + 115) or 3%. The calculation becomes even more complicated because the base rate in Jackson, Aitken and Roberts’, research was derived in a laboratory where they chose to provide scents from cadavers around two-thirds of the time (or roughly 66%). That seems quite high. In the real world, crime scenes with traces of bodies are likely to be rarer than that. Let us assume that in the real world the base rate is about 1 in 10 of suspected murder scenes (or 10%).
So, if a dog in the real world indicates a body, what is the probability there really has been a body?
This is really difficult to calculate, even for experts, so just do your best. Select your answer from the options below. Once you have made your selection, remember to click ‘Save response’. The results of the poll will be displayed in the discussion below.
Comment
The results of the poll are displayed below. You may need to refresh your browser to load the results.
We know that even experts make mistakes with such calculations most of the time (see Gigerenzer, 1996, and Hoffrage and Gigerenzer, 1998). People seem to struggle with probabilities. However, Gigerenzer and others have suggested that presenting the numbers as ‘natural frequencies’ makes it a bit easier. That effectively means starting with an obvious number of cases.
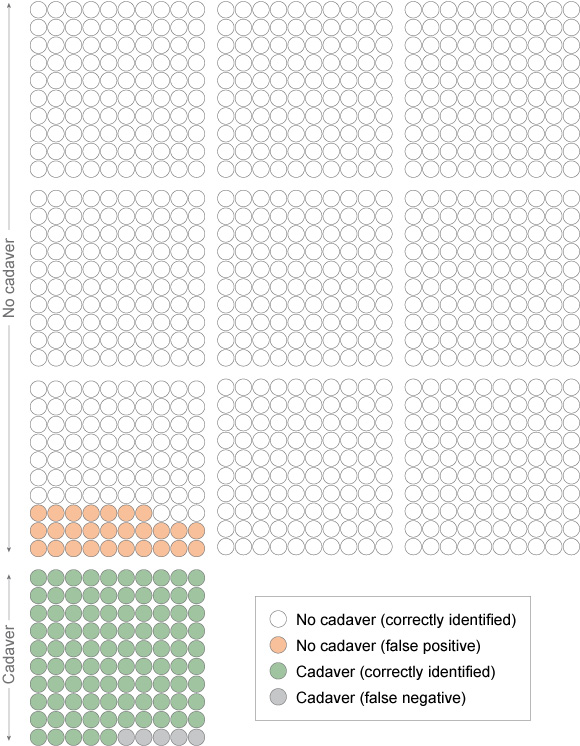
This time, imagine 1,000 criminal cases where there might have been a body. Of these, based on the base rate assumption of 1 in 10, there will have been a body in 100 cases and no body in 900 cases. Where there has been a body, the dogs will detect it in 95 of those cases (as we worked out they would spot it in 95 per cent of cases and miss it in 5 per cent). If there is not a cadaver, the dogs will nonetheless wrongly indicate there has been a cadaver in 27 of those 900 cases (as we know they will wrongly indicate in 3 per cent or 3 out of every 100 cases). Figure 16 presents this same information visually.
Now try answering the question again:
If a dog indicates a body, what is the probability that there really has been a body? Hopefully this is a little easier. Again, remember to click ‘Save response’ after you make your selection.
Comment
The results of the poll are displayed below. You may need to refresh your browser to load the results.
The correct answer is 78%. You can work it out because out of 1,000 cases, a dog will indicate 122 times (95 + 27). Of these, 95 will be correct but 27 will be false positives. So the right answer is 0.78 (95/122) or 78%. Another way of seeing this is by looking at the ratio of the coloured dots in Figure 16. The pink and green dots represent the times that the dog indicates. Pink is a false positive and green is a correct identification. The ratio of the green dots out of all the coloured dots is 78%.
You may still have made a mistake the second time, but the research shows that far fewer mistakes are made when the statistics are presented as natural frequencies. The argument is that experts should present test results in natural frequencies to prevent the types of avoidable errors that happen with expert evidence.