2.1 Background of WASH in Ethiopia
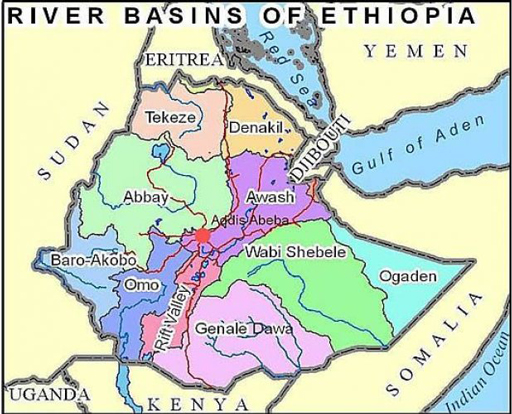
Ethiopia faces many challenges to provide safe water for all, however the country is not short of water. Across Ethiopia as a whole there is relatively high rainfall and there are many large rivers. It has been estimated that the annual surface run-off in Ethiopia is 122.8 billion m3 and groundwater potential is 2.6 billion m3 (Tafesse, 2008). However, these water resources are not distributed evenly, either by geographical area or through the year. Figure 2.1 shows a map of the main river basins of Ethiopia. 80–90% of Ethiopia's water resources is found in four river basins in the west of Ethiopia namely, Abbay (Blue Nile), Tekeze, Baro Akobo and Omo. These areas have most of the water but only about one third of the Ethiopian population lives in these regions. The east and central river basins have only 10–20% of water resources but the population there is over 60% of the total (MoWR, 1999).
The unevenness of distribution over time is also a problem. As you will know, different parts of the country have marked wet and dry seasons which means water is not always available when needed. Furthermore, the predicted seasons are not always reliable and rains may come early or late, or not at all in some years.
This mismatch in distribution means that water is not available at all times for everyone. This, coupled with limited financial and technical resources, has meant that Ethiopia’s abundant water resources have not been utilised to their full potential. Furthermore, there are the challenges facing the WASH sector that you learned about in Study Session 1. However, despite these many difficulties, there have been significant improvements in water supply and sanitation provision over the past 25 years. Figure 2.2 shows how access to water and sanitation has improved since 1990.
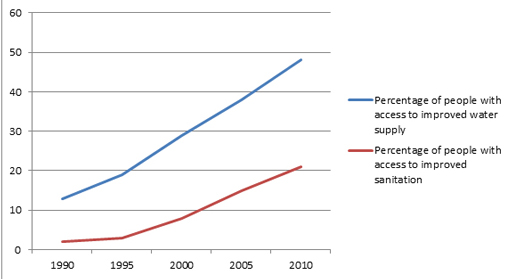
The population of Ethiopia in 2010 was approximately 87 million. Using data from Figure 2.2, how many people, to the nearest million, did not have access to improved water supply and how many did not have improved sanitation at that time?
Reading from the graph, 48% of people had access to improved water in 2010. 48% of 87 million is 42 million (87 × 0.48). The figure for sanitation is 21%. 21% of 87 million is 87 × 0.21 = 18 million. The question asks for numbers of those who did not have access, therefore the answers are 87 − 42 = 45 million people did not have access to safe water and 69 million did not have access to improved sanitation.
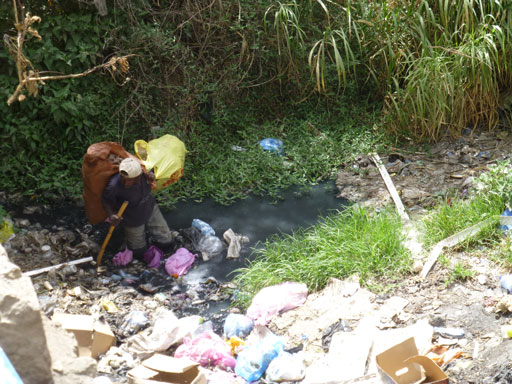
Note that the data in Figure 2.2 is for the total population of Ethiopia, but you should also be aware of the differences between urban and rural areas. WASH provision in urban areas is generally much better. By 2012, 97% of people living in urban settings as opposed to 42% of the rural population had access to improved water. For open defecation, only 8% of urban dwellers compared to 43% of rural populations were practising open defecation in 2012 (JMP, 2014a). As a proportion of the total, far fewer people live in towns than in rural areas (less than 20%), but the density of the population is much greater in urban areas than in the countryside. In many cities the rivers and streams have become open sewers polluted with human wastes of all types (Figure 2.3).
The improvements over recent decades indicated in Figure 2.2 have come about in part because of developments in national plans and policies to address the problems of WASH. The following sections describe the main policies, strategies and programmes that preceded and established the foundation for the OWNP.
Learning Outcomes for Study Session 2