
Self-Assessment Questions (SAQs) for Study Session 12
Now that you have completed this study session, you can assess how well you have achieved its Learning Outcomes by answering the questions below. Write your answers in your Study Diary and discuss them with your Tutor at the next Study Support Meeting. You can check your answers with the Notes on the Self-Assessment Questions at the end of this Module.
SAQ 12.1 (tests Learning Outcomes 12.1, 12.2, 12.3, 12.4 and 12.6)
Which of the following statements is false? In each case, state why it is incorrect.
A Malaria epidemics are defined as the occurrence of cases in excess of the number expected in a given place and time period.
B Malaria epidemics can sometimes occur during the dry season.
C The contingency stock of Chloroquine tablets is 25% of the stock that is required to treat all P. vivax cases in a non-epidemic year.
D The reason why you use an epidemic monitoring chart or doubling of weekly cases at Health Post level is to detect epidemics early and report to district level without taking any control measures.
Answer
A is true. Like any other epidemics, a malaria epidemic is defined as the occurrence of cases in excess of the number expected in a given place and time period.
B is true. Malaria epidemics can occur during the dry season because the rivers that might get interrupted or shrink can create breeding sites for the Anopheles mosquitoes, and lead to epidemics.
C is true. As a rule 25% of contingency stock should be kept for the drugs and supplies that are required for the management of epidemics.
D is false. The purpose of early detection of malaria epidemics is so action can be taken to contain them before they get out of control and affect a large number of people. You are the first to take action against any malaria epidemics that are detected. Of course you also report to the district level.
SAQ 12.2 (tests Learning Outcome 12.3)
Assume your village is located in a malaria epidemic risk area. An unusually heavy rain in your area ended one week ago. Now the weather becomes full of sunshine. About 500 migrant workers come to your village from a non-malarious area one week after the rain ends to work on agriculture. From this story list the factors that might trigger a malaria epidemic.
Answer
The factors in the story that might trigger a malaria epidemic are:
- Heavy rainfall, followed by sunshine and warm temperatures, can lead to good breeding conditions for mosquitoes.
- High numbers of migrants who were not immune to malaria parasites because they came from a non-malarious area.
SAQ 12.3 (tests Learning Outcome 12.4)
List the drugs and supplies that you are required to keep in your contingency stock.
Answer
The following are the lists for your contingency stock:
Drugs
- Chloroquine tablets
- Chloroquine syrup
- Coartem tablets
- Quinine tablets
- Artemether injections
- Artesunate suppositories
Supplies
- Multispecies Rapid Diagnostic Tests (RDTs)
- Insecticide for indoor residual spraying
- Temephos for larval control.
SAQ 12.4 (tests Learning Outcome 12.5)
What are the main malaria epidemic prevention strategies?
Answer
IRS, larval control and distribution of ITNs are the main malaria epidemic prevention strategies
SAQ 12.5 (tests Learning Outcome 12.6)
Table 12.4 contains seven years of weekly data on malaria cases. Study the table and then answer the questions below it.
| Week No. | 1998 | 1999 | 2000 | 2001 | 2002 | 2003 | second largest number | This year (2004) |
|---|---|---|---|---|---|---|---|---|
| 1 | 16 | 42 | 105 | 36 | 14 | 42 | 33 | |
| 2 | 12 | 42 | 100 | 38 | 17 | 22 | 35 | |
| 3 | 16 | 42 | 103 | 49 | 21 | 34 | 40 | |
| 4 | 20 | 17 | 134 | 59 | 32 | 40 | 39 | |
| 5 | 34 | 17 | 146 | 20 | 30 | 39 | 33 | |
| 6 | 18 | 10 | 134 | 29 | 23 | 27 | 30 | |
| 7 | 30 | 19 | 133 | 24 | 25 | 25 | 29 | |
| 8 | 37 | 10 | 127 | 41 | 23 | 42 | 42 | |
| 9 | 32 | 18 | 137 | 29 | 26 | 29 | 35 | |
| 10 | 31 | 24 | 128 | 17 | 13 | 32 | 30 | |
| . | . | . | . | . | . | . | . | |
| 51 | 26 | 40 | 134 | 32 | 39 | 39 | . | |
| 52 | 23 | 35 | 110 | 27 | 25 | 33 | . |
- a.Which year do you think the data shows an abnormally high number of malaria cases? What do you do with this year before you start identifying the second largest number?
- b.Identify the second largest number for the six years of data (1998–2003) and fill in the column in the table.
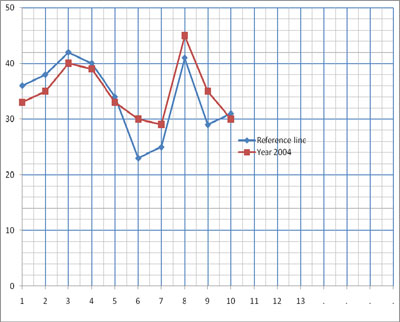
- c.Use the blank epidemic monitoring chart in Figure 12.2 to plot a reference line of the second largest numbers and the data for the year 2004 against it.
- d.Does the graph show weeks when an epidemic occurred? If yes, in which weeks?
Answer
| Week No | 1998 | 1999 | 2000 | 2001 | 2002 | 2003 | 2nd largest number | This year (2004) |
|---|---|---|---|---|---|---|---|---|
| 1 | 16 | 42 | 105 | 36 | 14 | 42 | 36 | 33 |
| 2 | 12 | 42 | 100 | 38 | 17 | 22 | 38 | 35 |
| 3 | 16 | 42 | 103 | 49 | 21 | 34 | 42 | 40 |
| 4 | 20 | 17 | 134 | 59 | 32 | 40 | 40 | 39 |
| 5 | 34 | 17 | 146 | 20 | 30 | 39 | 34 | 33 |
| 6 | 18 | 10 | 134 | 29 | 23 | 27 | 27 | 30 |
| 7 | 30 | 19 | 133 | 24 | 25 | 25 | 25 | 29 |
| 8 | 37 | 10 | 127 | 41 | 23 | 42 | 41 | 42 |
| 9 | 32 | 18 | 137 | 29 | 26 | 29 | 29 | 35 |
| 10 | 31 | 24 | 128 | 17 | 13 | 32 | 31 | 30 |
| . | . | . | . | . | . | . | . | |
| 51 | 26 | 40 | 134 | 32 | 39 | 39 | 39 | . |
| 52 | 23 | 35 | 110 | 27 | 25 | 33 | 33 | . |
- a.It is the year 2000. As you can see from Table 12.4 the weekly cases in 2000 are abnormally higher than the other five years of data. As a principle you do not use the 2000 data in constructing the normal chart. So before you identify the second largest number, remove the year 2000 from the data.
- b.See the table for the second largest number for the six years of data filled in the correct column.
- c.The reference line of the second largest numbers and the data for the year 2004 are shown in Figure 12.5.
- d.As you can see from Figure 12.5, epidemics occurred in weeks 7 to 10.
SAQ 12.6 (tests Learning Outcome 12.7)
What is mass fever treatment and which drug do you use for it?
Answer
Mass fever treatment means treating all the people who have fever without testing with RDTs, followed by malaria treatment to contain epidemics. The drug you give is Coartem, except for those contraindicated for whom you give quinine tablets.
SAQ 12.7 (tests Learning Outcome 12.8)
What do you think is the benefit of post-epidemic assessment?
Answer
Post-epidemic assessment benefits you in such a way that you learn your strengths and weakness. During the next epidemic you will correct your weaknesses and become more efficient in preparedness, detection, prevention and control of the epidemic.
Summary of Study Session 12