

4 Weaknesses of the Body Mass Index
The BMI is just a measure of weight relative to height, and as such is very much an imperfect health metric. For example, a very muscular person may weigh more because muscle is denser than fat. So they may have a higher BMI than someone who has less muscle but is the same height. You will explore this further below. It is not a person’s high BMI per se that should cause concern so much as an unhealthy diet and lack of physical activity, as these factors are the leading causes of the major non-communicable diseases, such as diabetes and cardiovascular disease (WHO, 2004).
Researchers have also questioned the representativeness of BMI as a health measure:
Primarily derived from data obtained on Anglo-Saxon populations, the generalizability and applicability of the BMI and its cut-off points to other populations has been questioned and its sensitivity as a measure of excess fat queried.
Activity 3 BMI categories explored
Part A
Use the BMI chart in Figure 4 to identify into which category (i.e. ‘underweight’, ‘healthy weight range’, ‘overweight’, ‘obese’ or ‘morbidly obese’) each of the three people below fit. ‘Underweight’ is shown in green; ‘healthy weight range’ in blue; ‘overweight’ in white; ‘obese’ in orange; and ‘morbidly obese’ in purple. (If you would like to access a larger version of the image click on ‘View larger image’.)
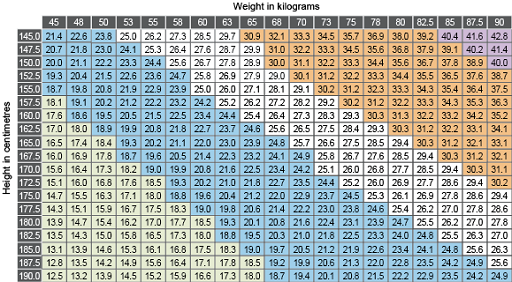
| Name | Height (cm) | Weight (kg) |
|---|---|---|
| Kaya | 166 | 85 |
| Bradley | 158 | 86 |
| Amber | 171 | 90 |
a.
underweight: <18.5 kg/m2
b.
healthy weight range: 18.5–25 kg/m2
c.
overweight: 25–30 kg/m2
d.
obese: 30–40 kg/m2
e.
morbidly obese or severely obese: >40 kg/m2
The correct answer is d.
a.
underweight: <18.5 kg/m2
b.
healthy weight range: 18.5–25 kg/m2
c.
overweight: 25–30 kg/m2
d.
obese: 30–40 kg/m2
e.
morbidly obese or severely obese: >40 kg/m2
The correct answer is d.
a.
underweight: <18.5 kg/m2
b.
healthy weight range: 18.5–25 kg/m2
c.
overweight: 25–30 kg/m2
d.
obese: 30–40 kg/m2
e.
morbidly obese or severely obese: >40 kg/m2
The correct answer is d.
Comment
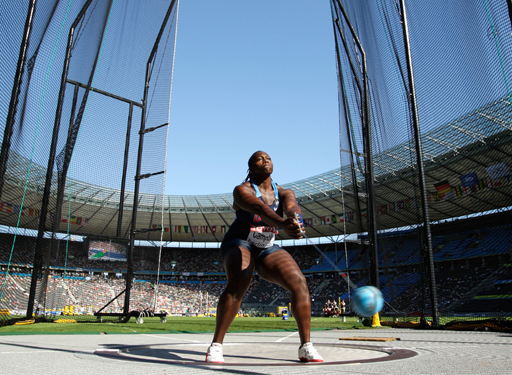
Each of the people fall into the obese category. Kaya and Amber each have a BMI around 31 kg/m2, while Bradley has a BMI around 34 kg/m2. Based purely on their BMI you might assume that they are in poor health, but this would not be accurate, as each person would have been on peak form at this weight in order to compete in the 2016 Rio Olympic Games:
- Kaya Salman represented Turkey in athletics
- Bradley Edward Tandy represented South Africa in swimming
- Amber Campbell represented the United States in athletics.
To see how your height and weight compares to an Olympian’s, you can check out this tool from the BBC: Who is your Olympic body match? [Tip: hold Ctrl and click a link to open it in a new tab. (Hide tip)]

Part B
Watch this brief video where people describe what a healthy body looks like and are asked to offer advice to Bradley and Amber, who according to their BMI are obese.
Transcript: Video 1
[MUSIC PLAYING]
WOMAN 1
I don't think that there is a healthy body in terms of a specific example. I think the key is to not compare yourself to others. I think that the media has a lot to answer for in that respect. And just being you, again, finding happiness, finding that balance.
WOMAN 2
Being active enough, eating well, being able to enjoy your life, your work, your family, and the things you enjoy doing.
MAN
Healthy body, I think it's really what's on the inside, if you feel good about yourself, if you feel energised.
WOMAN 3
You should be strong, not necessarily skinny and not necessarily-- I don't think necessarily if you're overweight, that means you're unhealthy. You can be a very slim person and still be really unhealthy, just eating junk food or not eating a lot of food.
MATHIJS LUCASSEN
We can measure our health. We've got many ways in which we can do this, a couple that stand out. One is around our healthy eating. And it's the public health message that's five-plus fruit and veg a day. Another way in which health is commonly measured or is a proxy measure is the body mass index, taking into account a person's height as well as their weight and determining whether or not they're in the healthy weight range or whether or not they're seen as being obese or larger.
[MUSIC PLAYING]
WOMAN 3
I would tell Bradley and Amber to maybe start going on some brisk walks at lunchtime. I would tell them to cut out fizzy drinks, any chocolate or snacks.
WOMAN 4
To make it fun, make it seem like it's not a diet, make it a lifestyle change, so maybe buy some recipe books, and be a bit experimental in the kitchen.
WOMAN 3
And just eat three meals a day. And no, they can have snacks, actually, just not unhealthy snacks, things like nuts or fruit or a bit of carrots and hummus will do.
WOMAN 4
Try and move a little bit more, maybe count your steps each day, maybe do some more work around the house. Even hoovering is exercise. So little things, not drastic changes.
WOMAN 1
If the gym is not for you, looking at sport or simply walking, enjoying nature. It's all about balance and moderation, trying to find meals that you enjoy that are healthy, not too much of anything. Balance is key, to be honest.
[MUSIC PLAYING]
MAN
OK.
CREW
So they're obese.
MAN
OK.
WOMAN 2
This is my point.
WOMAN 5
They're not obese. They're definitely not.
WOMAN 4
Is this the shock?
WOMAN 1
Yeah. So they don't even look like-- you would never think that they were obese in any way.
WOMAN 3
I don't think those people are obese at all. They're obviously very strong people. So I think their muscle mass would weigh a lot more than other people. So yeah, I'm completely surprised by the fact they've been labelled as obese.
MAN
I am a little bit surprised, but I know that it's quite-- what's the definition of obese is quite surprising. I've definitely got friends and family who've done the BMI type thing and got their readings, have seen it and gone, wow, I didn't realise I was-- and I always think of myself as well underweight, but then it's like, oh, I'm not actually that far off, really, where I should be. So it is definitely-- it's a bit surprising.
WOMAN 5
Very healthy people. I can see that they're athletes. He's won a medal. He's obviously doing good in what he's doing. She looks quite strong and healthy. So it's interesting to see that they've been referred to as obese.
WOMAN 6
I'm not surprised. Muscle is denser than fat. So it takes up less room than fat. So even though they're slim, fit, healthy people, they'll be heavier than somebody of the same size who's got less muscle density.
[MUSIC PLAYING]
MATHIJS LUCASSEN
As we can see with the case of Bradley and Amber, Body Mass Index, or BMI, is a crude measure and it does have its limitations. In our free course, we explore health and well-being in a critical way and put something like the body mass index into context in relation to other ways of making sense of our health and our well-being.
What can you conclude about the health of Kaya, Bradley and Amber, as a result of determining their BMI?
Comment
Very little can actually be determined about their health based on their BMI. One would assume, by virtue of being Olympians, that they are in very good health. As such it is fair to say that BMI is not an especially valid measure of health, but it is often used as a proxy measure, in other words a ‘rough tool’ to determine whether a person is overweight or obese.
Part C
Now you are invited to consider your own BMI.
1. Without using the BMI chart, estimate which weight category you think you are likely to be in. Remember, the categories are ‘underweight’, ‘healthy weight range’, ‘overweight’, ‘obese’ and ‘morbidly obese’.
Comment
Based on the results presented in Figure 3 (and if you are living in England) almost two-thirds of adults are categorised as obese or overweight.
2. Use the BMI chart in Figure 4 to determine your BMI. Use this link from the NHS to identify your weight category. Comment on whether or not the results surprise you and why that is.
Comment
Was it straightforward to accurately establish your current weight (which is not easy to do if you do not have access to scales) and height (which reduces slightly as we age)? Were you surprised by your BMI result? Or did your BMI result confirm what you already estimated in Part C, Question 1? For further details about BMI you can read this information from the NHS.
Despite widespread recognition among policymakers and public health agencies that BMI is a crude measure, the ease and convenience of its use make it a popular and widely used metric. So even though it is far from perfect, BMI is still frequently used. Quantitative researchers use BMI in health research, as well as other measures, to describe patterns and trends (e.g. in terms of life expectancy, poverty and physical activity levels) among certain population groups. This is helpful in terms of establishing which population groups require more assistance. For example, a study led by researchers at The Open University, found that there were no significant differences in terms of BMI between sexual and gender minority young males when they were compared to heterosexual cisgender (i.e. non-transgender) males in a nationally representative sample of secondary school students in New Zealand (Lucassen et al., 2019). While almost half of the sexual and gender minority young females in the same study were overweight or obese, and they were significantly more likely to be overweight or obese compared to heterosexual cisgender females (Lucassen et al., 2019). Quantitative research is therefore helpful in terms of not only making visible and defining health and social care problems (as well as exploring inequalities between groups), but also in shaping what policymakers do in response to these problems.