Skip to content
Skip to main content

About this free course

Download this course

Share this free course

Plate tectonics
Plate tectonics

Start this free course now. Just create an account and sign in. Enrol and complete the course for a free statement of participation or digital badge if available.

Figure 25
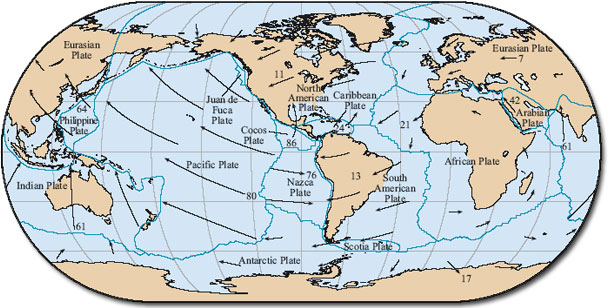
Figure 25 Map showing present-day motion of lithospheric plates (indicated by arrows) relative to hot spots (i.e. true plate motion). The lengths of the arrows indicate the amount of movement that would occur over a period of 50 Ma and the figures represent the current mean true plate speed.

 4.2 Hot-spot trails and true plate motions