

Courtesy of Daniel Nettle ©
Courtesy of Daniel Nettle
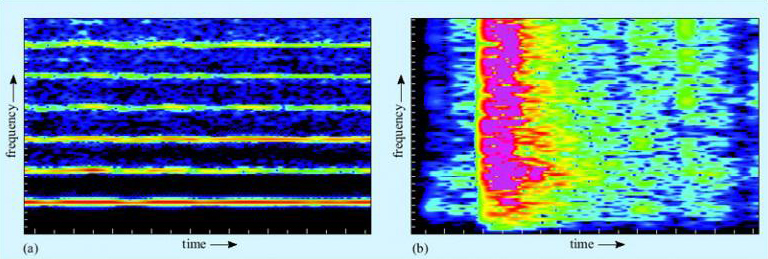
Figure 3 Spectrogram of (a) a single note from a flute; and (b) a box being dropped on the floor. Black represents no acoustic energy at a given frequency. The ‘hotter’ the colour (i.e. towards the red or yellow end of the spectrum), the greater the concentration of energy at that frequency. Note in (a) that the greatest concentration of energy is in the lowest band (the fundamental frequency), with regular and increasingly faint harmonics at higher frequencies. The harmonics have clear gaps between them, which creates the feeling of a pure and tuneful note. In (b), by contrast, the acoustic energy is smeared across the whole frequency range, making it sound like a noise rather than a note.